The accurate estimation of the difficulty level of the questions posed to learners is essential to help them learn more effectively and efficiently. The difficulty level of questions is relevant for:
- facilitating better learner assessment by understanding how they are performing on different difficulty level questions
- facilitating customization of question difficulty level for practice revision
- facilitating coach's assessment (ICONIC) - how they have worked on improving learners performance
- facilitating feedback to educators - e.g., learners not performing well in easy questions of particular concepts
However, the difficulty level of the questions is subjective, i.e., similar questions are being marked as easy by one creator and difficult/medium by another; this is a pain point for us since we work with multiple content creators. Hence, a gap exists between the educators' estimate and the student's perception of the question difficulty.
To address the issue mentioned above, we want to estimate the difficulty level of the questions in the range of 1 - 5, taking into account the time taken by the learners in attempting the question, the number of correct and incorrect attempts to the question, and the learners' proficiency in attempting a question.
Initial approach
A simple approach to estimate the difficulty level of the question is to calculate the proportion of incorrect vs. correct answers and the median time taken by the learners in attempting the question. The estimate for the difficulty level of question $ i $ can be defined as follows:
$$ \beta_i = w_1*\log (\frac{n^i_{ic}}{n^i_c}) + w_2 * (\frac{t^i_{median} - t_{min} }{t_{max} - t_{min}}) + (5 - 2 * w_1 - w_2), $$
where $ \beta_i $ is the estimated difficulty of question $ i $, $ n_{ic} $ is the number of incorrect attempts to question $ i $, $ n_c $ is the number of correct attempts to question $ i $, $ t^i_{median} $ is the median time taken by the learner's to solve question $ i $, $ t_{min} $ is the minimum time taken by learners to solve any question in a particular concept, and $ t_{max} $ is the maximum time taken by learners to solve any question in a particular concept.
Weights $ w_1 $ and $ w_2 $ are the hyper-parameters that can be tuned based on the preference one wants to give to the incorrect vs. correct answers and the time taken by the learner in attempting the question. The following examples illustrate the changes in the estimated question difficulty for different settings of weights $ w_1 $ and $ w_2 $ :
- Setting $ w_1 = w_2 = 1 , n^i_{ic} = 20, n^i_c = 120, t^i_{avg} = 30, t_{min} = 10, t_{max} = 180 $, gives $ \beta_i = round(1.339) = 1 $.
- Setting $ w_1 = w_2 = 1 , n^i_{ic} = 200, n^i_c = 30, t^i_{avg} = 100, t_{min} = 10, t_{max} = 180 $, gives $ \beta_i = round(3.353) = 3 $.
- Setting $ w_1 = 0.7, w_2 = 0.3, n^i_{ic} = 200, n^i_c = 30, t^i_{avg} = 100, t_{min} = 10 $ , $ t_{max} = 180 $, gives $ \beta_i = round(4.035) = 4 $.
The above approach gives decent result, but it fails in a few scenarios, e.g., when a question is very hard, then only highly proficient learner's are attempting it, and say most of them are getting it correct, in such case $ \beta_i $ would be low as $ n_c $ is much higher compared to the $ n_{ic} $ count. To overcome such limitations, we chose to go with the Item Response Theory (IRT) model, which considers the proficiency of the learner attempting a question.
Item Response Theory (IRT)
The IRT model proposed by Rasch (Van der Linden & Hambleton, 1997) is used to estimate the difficulty level of the question. The IRT models the probability of answering a question correctly as a logistic function of the difference between the learner's proficiency level $ (\theta) $ and the question difficulty level $ (\beta) $, called the item characteristic function:
$$ \mathbb{P}(\text{answering question i correctly}) = c_i + (1-c_i) \frac{1}{1+\exp \left(- a_i (\theta_{p}-b_{i})\right)}, $$
where $ \theta_p $ is the learner’s proficiency who attempted question $ i $, $ b_i $ is the question difficulty parameter, $ a_i $ is the discrimination parameter, and $ c_i $ is the guessing parameter.
IRT Model with one-parameter
In the one-parameter IRT model we assume that the discrimination parameter $ a_i = 1 $ and the guessing parameter $ c_i = 0 $, which gives the following simplified item characteristic function:
$$ \mathbb{P}(\text{answering question i correctly}) = \frac{1}{1+\exp \left(-(\theta_{p}-b_{i})\right)}. $$
Estimating question difficulty using the IRT model
In the case of a typical test, a sample of $ M $ learners respond to $ N $ questions in the test. The proficiency levels of these learners will be distributed over a range of $ 1-5 $. We divide the learners into, say, $J$ groups along the scale so that all then learners within a given group have the same proficiency level $ \theta_j $ and there will be $ m_j $ learners within the group $ j $, where $ j = 1, 2, 3, \ldots, J $.
Within a particular proficiency level group, $ r_j $ learners answer the given question correctly. Thus, at a proficiency level of $ \theta_j $, the observed proportion of correct response is $ \mathbb{P}(\theta_j) = r_j/m_j $, which is an estimate of the probability of correct response at that proficiency level.
Example:
Question id is 339394
Proficiency levels group: [1, 1.5), [1.5, 2), [2, 2.5), [2.5, 3), [3, 3.5), [3.5, 4), [4, 4.5), [4.5, 5]
Mean Proficiency level: [1.25, 1.75, 2.25, 2.75, 3.25, 3.75, 4.25, 4.75]
Number of correct attempts : [3, 0, 7, 18, 21, 26, 7, 3]
Number of incorrect attempts : [26, 29, 114, 179, 97, 62, 9, 14]
Number of total attempts : [ 29  29 121 197 118  88  16  17]
Probability of answering question correctly : [0.10344827586206896, 0.0, 0.05785123966942149, 0.09137055837563451, 0.17796610169491525, 0.29545454545454547, 0.4375, 0.17647058823529413]
Estimated difficuilty level: [5.]
SMEs difficulty level: 5
Plotting the observed proportions of correct response in each proficiency level group, we get the result as shown below:
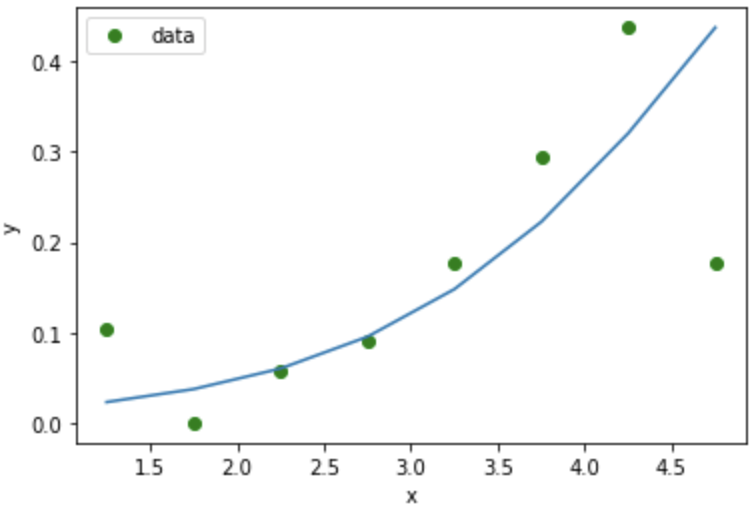
The essential task is to find the item characteristic curve that best fits the observed proportions of the correct response. The procedure used to fit the curve is based upon the maximum likelihood estimation. The above figure also illustrates an item characteristic curve fitted to the observed proportions of the correct response.
Parameters/ Features for the IRT model
- number of learners who answered a question correctly vs. incorrectly
- time taken by learners to attempt the question - e.g., minimal might imply question was not even read vs. whereas very long might mean the question was difficult (or that the learner was away from the system/ mobile)
- Each question is mapped to a particular concept, hence to take into account the guessing of the answer without reading the entire question, we ignore the attempts made by the learner, which are < 15 percentile of the time taken by all the learners across all the questions mapped to that particular concept
- proficiency of the learners attempting the question in that concept
- We do not estimate the difficulty level of questions that have < 3 number of attempts by the unique learner in each level of proficiency group, i.e., $ m_j < 3 $, as it would lead to a poor estimate of the question difficulty.
Results
To analyze whether the question difficulty estimated by the IRT model matches the actual question difficulty level. We asked five SMEs (Subject Matter Experts) to rate the difficulty level of 500 questions across two goals (IIT JEE and NEET-UG).
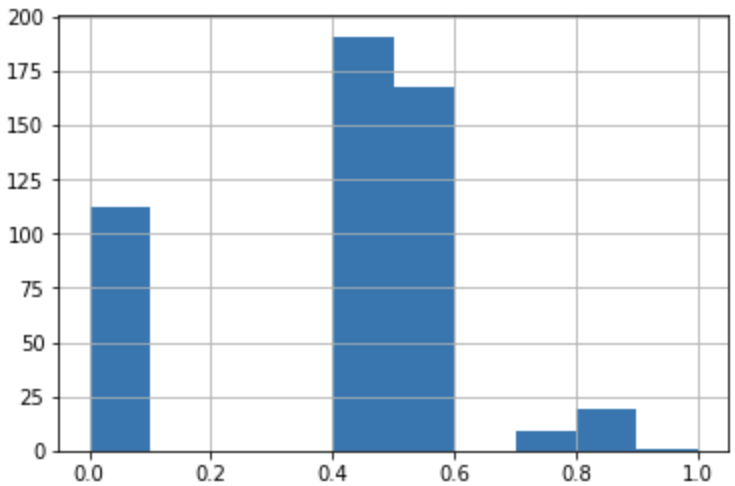
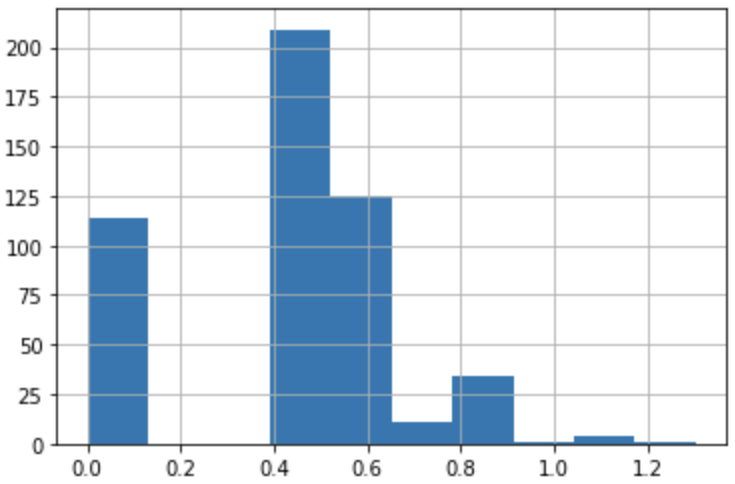
The plots below show the standard deviation among the five SMEs question difficulty ratings for IIT JEE and NEET-UG goals. This significant deviation in the question difficulty rating among the five SMEs proves our earlier statement that the difficulty level of the questions is subjective.
We consider the average among the ratings given by five SMEs as the actual question difficulty level and compare it with the difficulty level estimated by the IRT one-parameter model for both IIT JEE and NEET-UG goals.
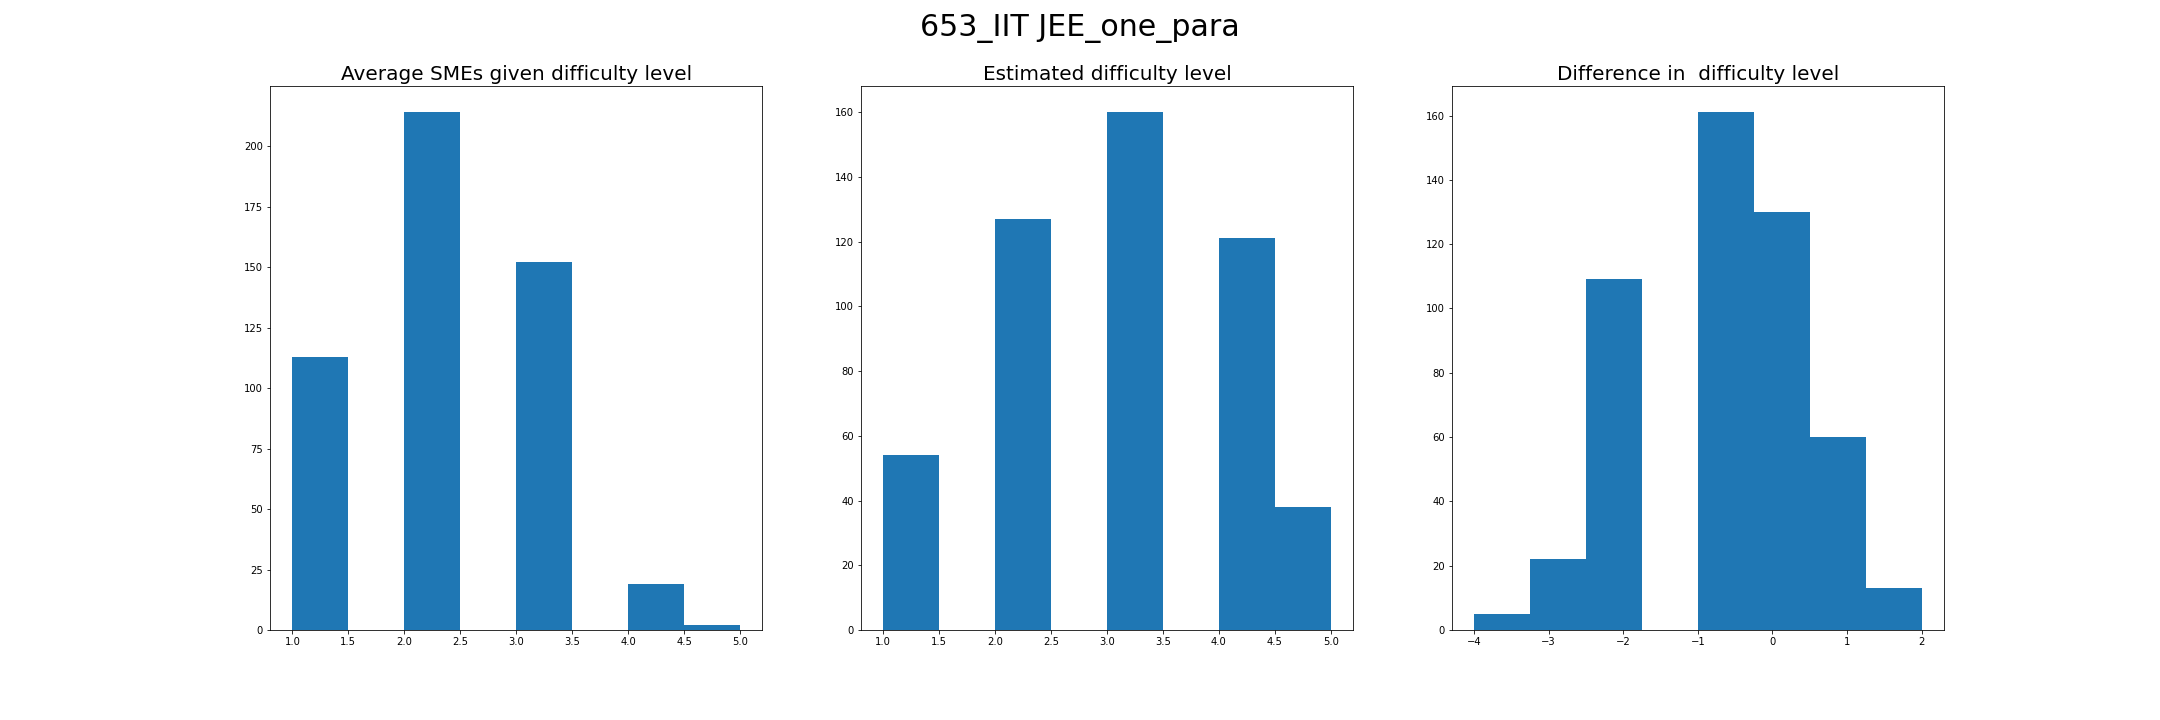
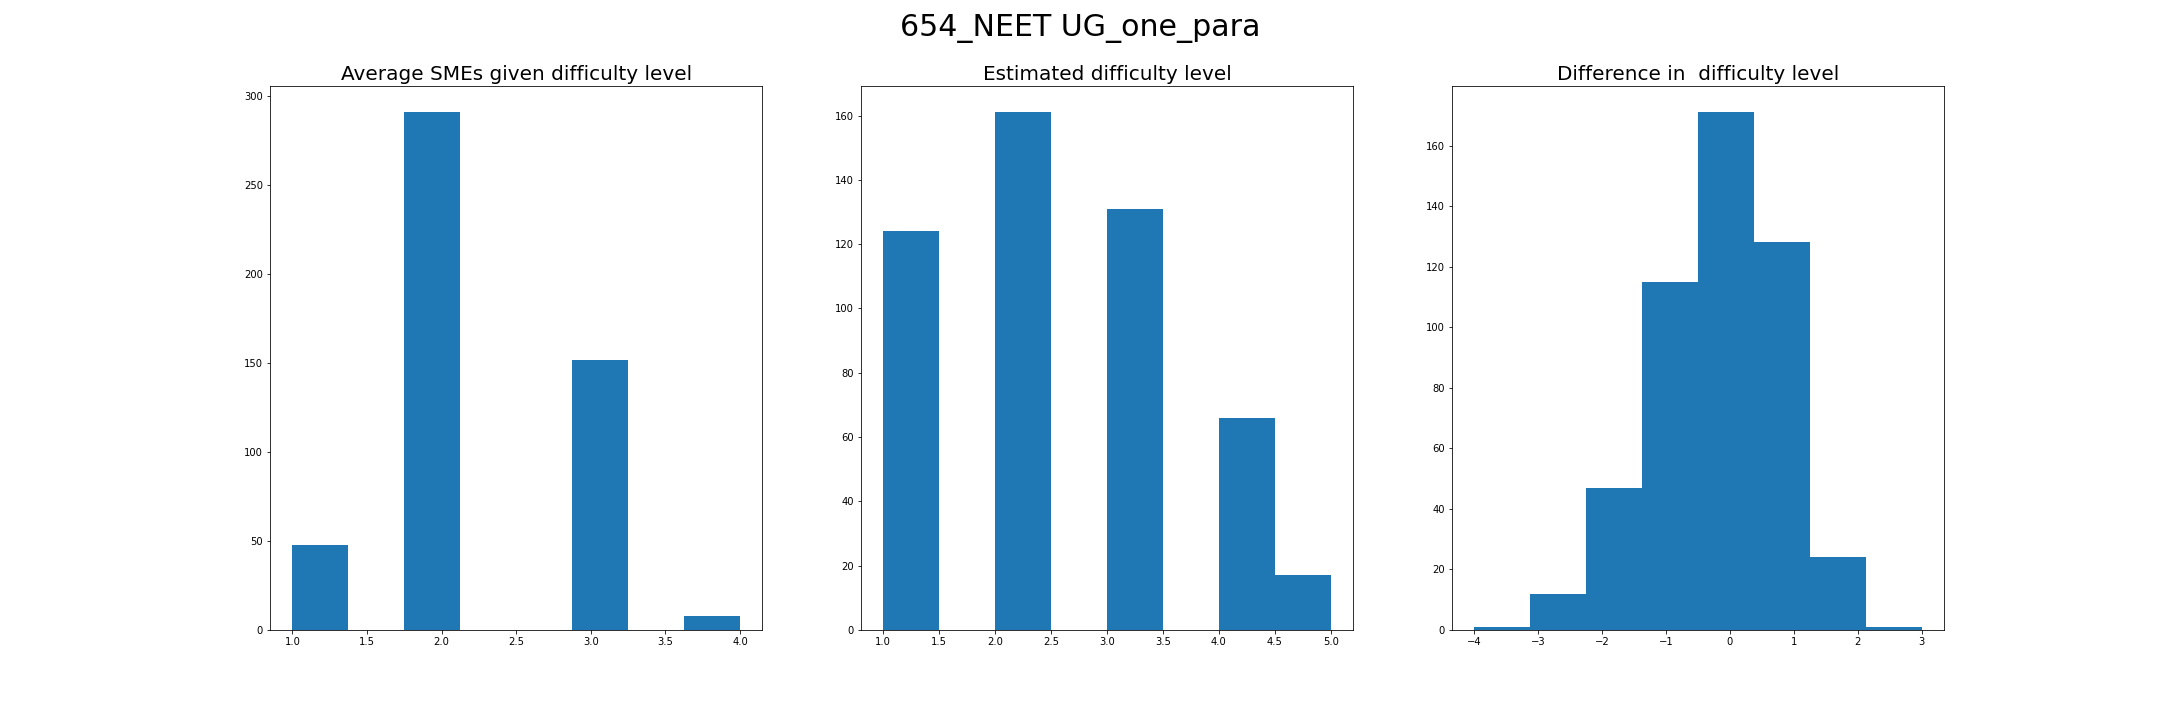
Observation: The estimated difficulty does not match the SMEs rating; furthermore, our goal is not to find a model that matches the ratings given by SMEs but to find a model that closely matches the learners' perception of the question difficulty.
For example, for the NEET UG goal, among the 500 questions, none of the five SMEs have given a difficulty level of 5 to a question. However, ideally, learners would find some questions very difficult (i.e., the difficulty level of 5). Ideally, we would want the question difficulty levels to be normally distributed with a few very-easy (1), very-hard (5), and most others around the medium. The same can be observed in the histogram of the estimated difficulty level, while the histogram of SMEs ratings is highly skewed.
Correlation: To further evaluate the efficiency of the IRT model, we plot the correlation between base_difficulty (i.e., difficulty given by content creators), estimated_difficulty (i.e., difficulty estimated by IRT model), and correct_percentage (i.e., correct attempts/total attempts).
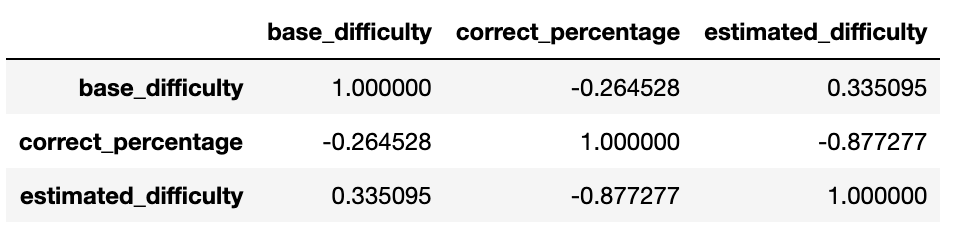
From the correlation between base_difficulty and correct_percentage, we can see that base difficulty is loosely correlated with the correct percentage of learners, whereas estimated_difficulty has a high correlation of $ -0.877 $, which shows that the difficulty level estimated using the IRT model is much closer to the learner's perspective of the question difficulty. Both the base_difficulty and estimated_difficulty are negatively correlated with correct_percentage because a question with more correct attempts is more likely to be easy (i.e., with less difficulty level).
Sanity check: We also performed a sanity check on the question difficulty estimated by the IRT model by dividing learners into two groups: a) high proficiency learners, i.e., learners whose proficiency $ \geq 4 $, and b) low proficiency learner, i.e., learners whose proficiency $ \leq 2 $. Then we showed both groups a set of questions for a week and observed that the group with high proficiency learners had more correct attempts than the low proficiency learners group, especially for the question having a high difficulty level.
Coverage: We have to set two hyper-parameters for the IRT model: i) $ J $ - the number of groups for dividing the learners based on their proficiency level, and ii) $ m_j $ - the minimum number of attempts by the unique learner in each proficiency level group. Initially, we chose $ J = 8 $ and $ m_j = 6 $, which gave question coverage of only $ 3\% $. Then we relaxed the hyper-parameter $ m_j $ by setting it to $ m_j = \min(3, $ median number of attempts across all the questions in a particular topology$ ) $, which increased our question coverage to $ 32.94\% $. Still, we could not estimate the difficulty level for all the questions; hence to increase the coverage of the questions, we designed another algorithm that is not dependent on the learner's attempts.
Question difficulty estimation using NLP
Since we could not cover all questions by the IRT model, we designed a Natural Language Processing (NLP) based supervised machine learning model that estimates the question difficulty given only the question metadata while ignoring the learners' attempt information. The question metadata was taken as input features, and the question difficulty calculated by the IRT model was taken as the target variable for the regression model.
For the NLP based model, the following question features are used:
- question_content
- options
- correct_answer
- question_type
We tried with EdBERTa and SentenceBERT to get embeddings for the question textual content and found that a combination of EdBERTa + SentenceBERT + CatBoost Ensemble model performed better than using just EdBERTa/SentenceBERT with CatBoost ensemble model.
Results: We compare the question difficulty estimate given by the NLP-based model with the IRT model and found that the difficulty level estimate given by NLP based model closely matches that of the IRT model with Mean Absolute Error (MAE) of $ 0.261 $ and root-mean-square deviation (RMSE) of $ 0.360 $.
Using the NLP-based model, we can estimate difficulty for all the questions giving coverage of $ 100\% $. Since this model emulates the IRT model-based score; without any learner and attempt information, it even solves the zero-day problem, i.e., we can estimate question difficulty even when there are very few attempts or zero attempts to the question. Further, once the question crosses the required learner attempts count threshold, we switch to the IRT model to estimate question difficulty more accurately.
Conclusion and future work
The difficulty level of the questions is subjective, and hence, to solve the gap between the educators' estimate and the student's perception of the question difficulty. We used the IRT model to estimate the question difficulty taking into account the time taken by the learners, the number of correct and incorrect attempts, and the learners' proficiency in attempting a question. Furthermore, to solve the zero-day problem with very few or zero attempts, we used an NLP-based model to estimate the question's difficulty from the question metadata.
Once we have enough questions estimated by the IRT model, as future work, we would like to finetune the EdBERTa model to directly estimate the question difficulty without the need for the CatBoost ensemble model.
Thanks to Rahul Thakur and Swapnil Ashok Jadhav for their contribution and suggestions.
References
- Baker, Frank B. The Basics of Item Response Theory. Clearinghouse on Assessment and Evaluation, University of Maryland, College Park, MD, 2001.
- Wauters, Kelly, Piet Desmet, and Wim Van Den Noortgate. "Acquiring item difficulty estimates: a collaborative effort of data and judgment." Proceedings of the 4th international conference on educational data mining. Eindhoven university of technology, Eindhoven, 2011.