Given that today's user is subject to a lot of fast-moving and fast-serving content, the modern user expects everything, and they expect it all instantly. 2 Seconds isn’t a lot of time (In fact it probably took 2 seconds for you to read to this point) but if a webpage loads in any more than 2 seconds, visitors start losing interest and, worse yet, forget what they came to the page for in the first place.
Considering how important content delivery and user experience are for Unacademy, page performance and load times are the primary focus areas for all pages.
Problems At Hand
- For high-traffic pages, page load time might be long, resulting in bounces and reduced user interest.
- Unacademy has a large chunk of its users situated in areas that don’t yet have super-fast internet connections, and the end goal of delivering world-class education to those people will not be achieved if those users are not able to access the content in the first place.
Why Optimise Page Performance?
Increase conversion rates
The faster a page loads for the user, the more likely they are to perform a conversion action. Pages that load faster are objectively better converting for the user. Just loading a page 2 seconds late decreases conversions by 1% (The average conversion rate being ~2%), at the scale that Unacademy operates, even a 1% increase in conversions could mean a significant bump in revenue and user engagement.
Data from Cloudflare reveals something interesting (Screenshot from their article on the topic of how the performance of a website links to the conversion rate of the website):
- Pages that loaded in 2.4 seconds had a 1.9% conversion rate
- At 3.3 seconds, the conversion rate was 1.5%
- At 4.2 seconds, the conversion rate was less than 1%
- At 5.7+ seconds, the conversion rate was 0.6%
- Walmart Found that for every 1-second improvement in page load time, conversions increased by 2%.
- COOK increased conversions by 7% by reducing page load time by 0.85 seconds.
- Mobify found that each 100ms improvement in their homepage’s load time resulted in a 1.11% increase in conversion.
Decreased user drop and bounce rates
Website users tend to lose track of their actions when they have to wait for a screen for more than 1 second and tend to drop off, this is very evident with the fast content and media users are subjected to every day, and hence, we must present the required data to the end-users as fast as possible, a user kept on the page and engaged with content is a chance at going one step further in the goal to provide world-class education to everyone.
Reduced Bandwidth Consumption
We’ve also been refactoring pages to ensure any data that are not required at first load, is not sent at first load. This is to ensure that the user’s browser isn’t bogged down processing things that are not important to the user’s load experience. As mentioned above, we cater to a large audience with suboptimal internet speeds and limits, and higher data consumption means a higher bill and potentially lower study times for the end-users.
Prerequisites For Optimal Page Performance
If you’re starting out building a web application, make sure to note the following pointers because they’ll help out a lot in the long run.
Have Route-wise code-splitting for your application
A framework like Next.js takes care of this but for React Apps built with Create React App, you’ll have to take care of it yourself. This ensures that the user does not have to download the entire application for accessing a single route of the application.
Only load components that you need
Lazy/Dynamic load components of your application as they are required for functionality. This is especially useful for UI Components that are only supposed to be loaded on the client-side or are required at a later point in time, for example, Snack Bar Components, Popups, etc.
Always prefer named/tree-shakable exports
Module bundlers like webpack, Parcel, etc can “tree-shake” those dependencies and only include what’s required. This is useful because tree-shaking leads to smaller bundle sizes, thus leading to a lesser amount of JavaScript that needs to be downloaded and executed on the user’s device, thus reducing blocking and load times. For instance, import * as Package from 'package' would include everything offered by the package into the bundle, which is seldom what you want.
Avoid too many re-renders of your application
New-age frameworks make re-renders extremely fast but a render not required is a render wasted after all.
Keep code as loosely coupled as possible
The more tightly coupled it is, the harder it gets to optimize and refactor at a later point in time.
Prefer Static Pages
For pages that don’t change often and have a high footfall, server-rendered pages add unnecessary load on the server to generate a new page each time the user visits a page.
Prefer Client-Side Rendered Pages for authenticated users
This ensures the first paint of an area like the dashboard is super fast, and all data can be loaded on the client-side once the user is already on the page. Pages behind a login wall do not have SEO constraints and hence content on these pages can be loaded post user visit. This is the approach a lot of websites including YouTube take, even for their homepage.
Keep external scripts to a minimum.
The more external scripts you have, the more the browser has to download, process and execute them, which bogs down the main thread and leads to unresponsive first-loads on lower-end devices (It is also problematic in the case of external scripts that are heavy and don’t have an efficient cache-policy since the browser would have to do it for every single visit to the webpage).
Approaches Taken to Optimise Pages
Considering the immense size of our codebase, and the number of users that visit some of the most visited pages of Unacademy, we started to look for effective ways to improve the performance of those pages.
As goes the approach, optimising the most visited pages is the most effective approach to gain maximum impact. For instance, even if we were able to shave 1.2 seconds off the load time of a famous educator’s page, we would end up saving roughly 2000 hours of user time every month.
In terms of bandwidth, just an average of 20KB saved on each page visit saves our users over 100 GigaBytes of bandwidth each month, just from the optimizations made to a single web page.
A few major performance improving methods that we researched and used along the way along with the extent of their impact are mentioned below:
Converting Pages To Static
Impact: High
Instead of rendering the page every time on the server-side, sending it to the user and then hydrating it again on the client-side. We can simply compile pages to plain HTML, CSS, and JavaScript and serve them to users. This method is especially useful for public pages that don’t change very often. We have found this to be the most effective and high-impact solution for most pages, and the effects can be seen directly in the documents mentioned above.
We also leveraged the power of Incremental Static Regeneration or ISR in short, to ensure that the thousands of goal pages and educator pages we had did not slow down our builds (It’s not ideal to generate them all at once during build time), instead, they are generated once when the first user visits them after a build, and are then cached for all the subsequent users for the next 5 minutes on average. This way, the first user that visits a static page, optimises the speed of the page for all subsequent visits to the page for the next 5 minutes.
During revalidation, we use a caching technique called Stale While Revalidate to send back a cached version of the page while a new version is being built.
Content Reduction
Impact: High
The reduction of content has a direct effect on the page performance since the browser and server both have less content to render in each render cycle and reconciliation process. Plus Google recommends a max of 2000 DOM elements for optimum performance and score.
From a user-experience point of view, the user can only take in a set amount of content in a single go, the more content you have on the page, the user tends to get overwhelmed. It might seem intuitive to give the user everything they need or have to offer in one go, but it’s practical to give them segregated bits of content one by one, both for performance and reduced user confusion.
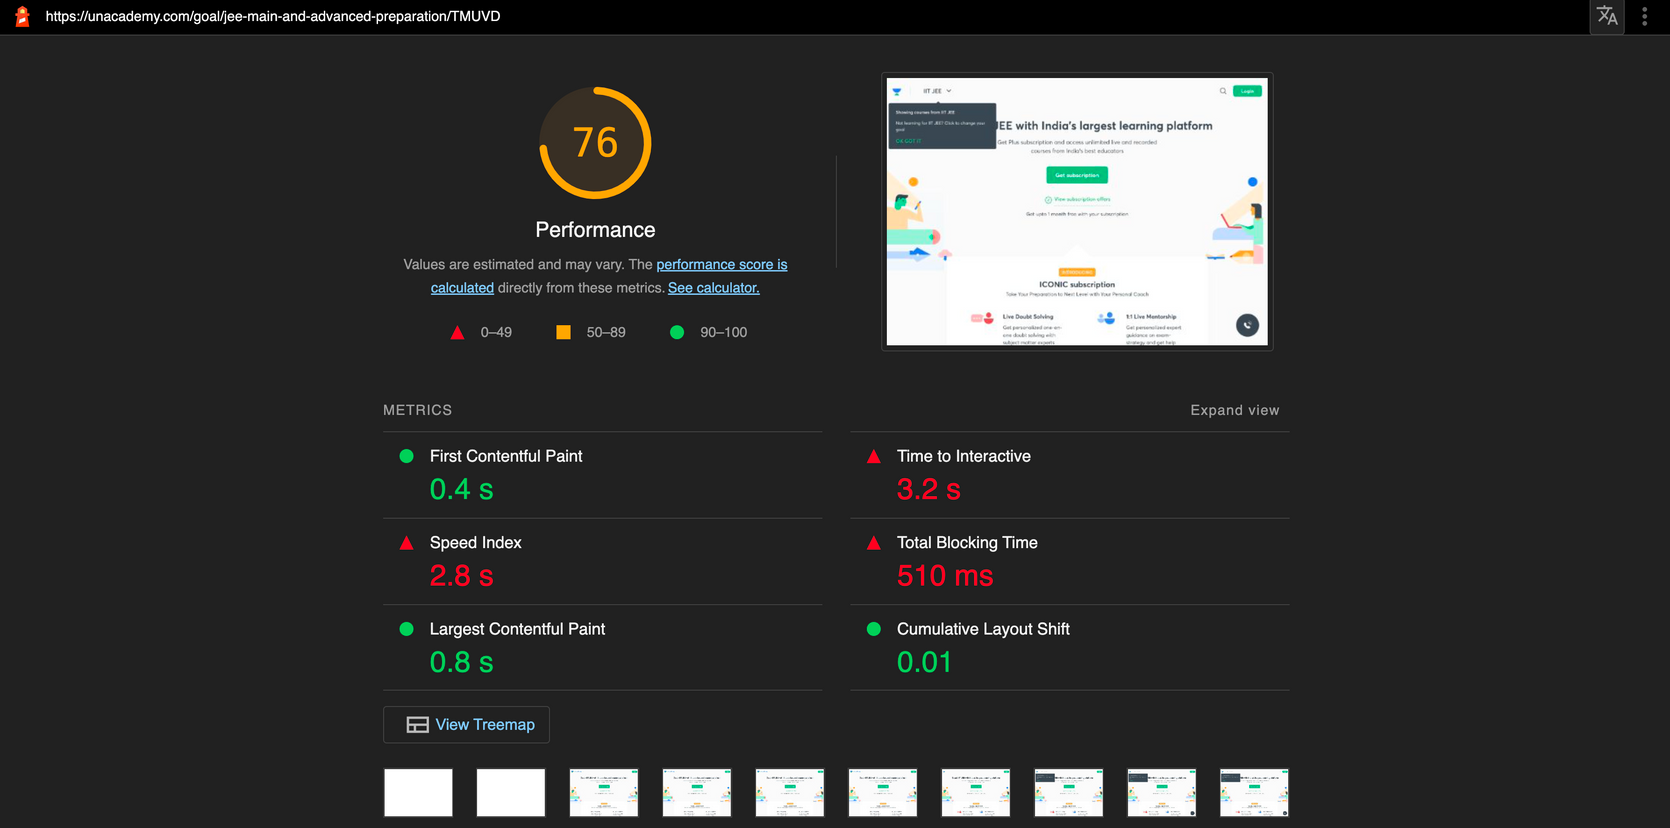
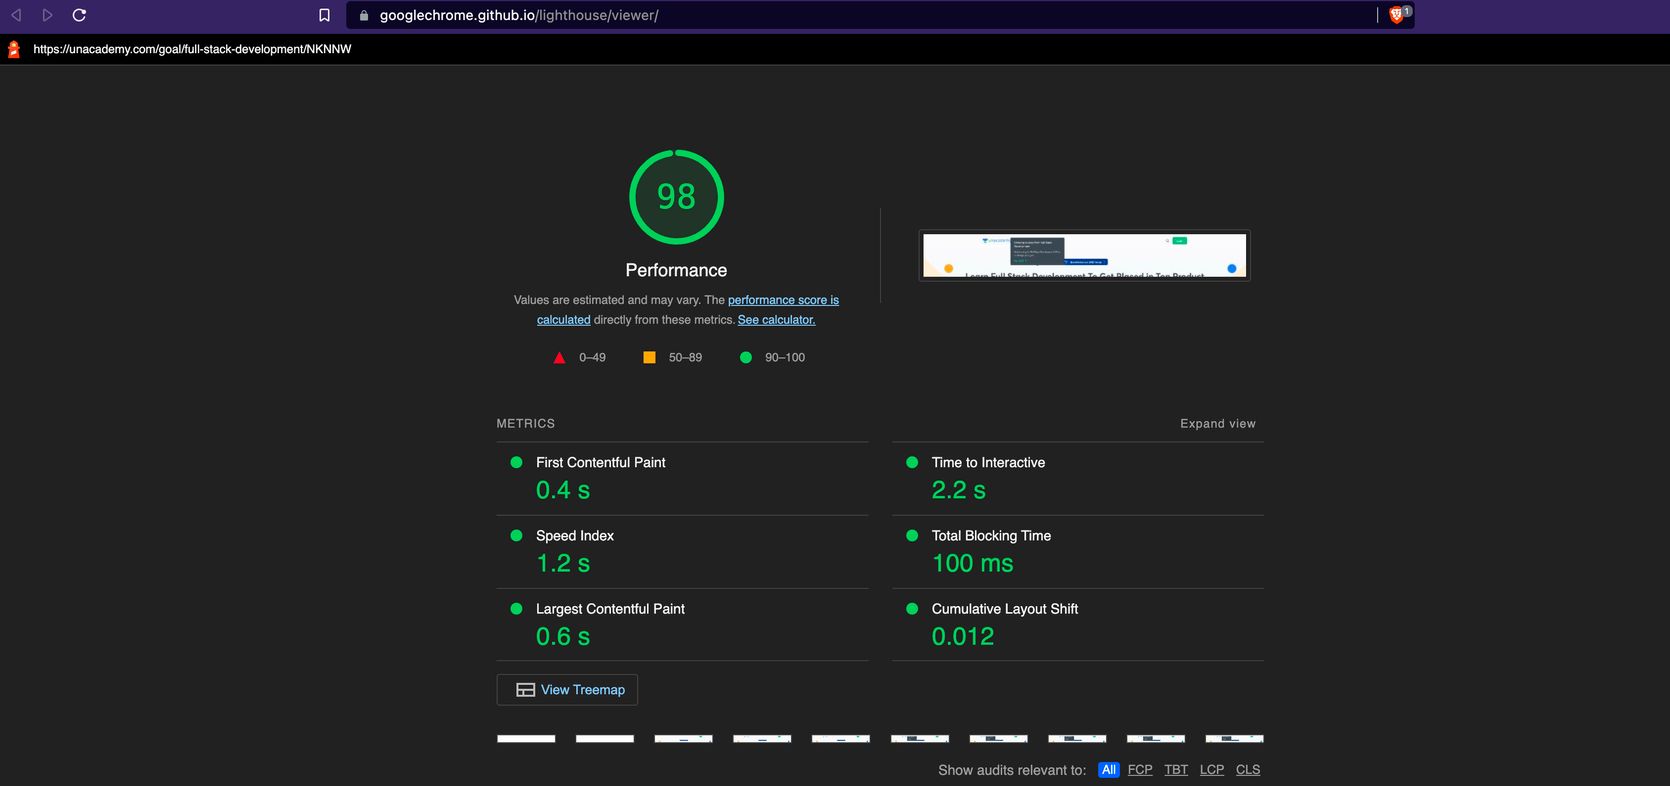
We noticed that reduction of content on a few of our major goal pages itself gave us a performance score jump from 76 to 98.
Lazy Loading Assets (Images/Videos)
Impact: High
Images and Videos loaded after a page has finished loading is optimum since images and videos are usually large assets that slow down the page significantly.
Equally important is having assets that are effectively sized and compressed, i.e: loading only as many static assets as needed. The good thing about static assets is that they can also be compressed/minified to the requirements of the page, it doesn’t make sense to be loading a 1000x1000 image when a 100x100 image would do the job, so auto-compression and serving of those images for varying screen sizes are always favourable.
Lazy Loading Page Fragments
Impact: Medium
Instead of showing the entire page’s content at once to the user, we can send them bits of the main content upfront and load the remaining content as they scroll. This also is a good technique to improve the first paint.
This approach is, however, better suited to authenticated pages that don’t have any SEO impact with partial content. Sending back partial content to public pages means search engines can’t fully read them and they might miss out on indexing points and rank lower in search results.
We use this approach on the goal browse page and every other page where there might be content that can be loaded once the user is on the page. Sites like YouTube and Twitter use this approach extensively.
Client-Side Rendering for Authenticated pages
Impact: Medium
For many authenticated pages, the optimal user experience is to load the page as fast as possible with minimal content and populate all the required data on the client-side with a skeleton loader in the background to give the user a feel of what’s to be rendered on their screen.
This is an approach used by YouTube where their home page is a fully static HTML page, with a skeleton loader, and all data/video suggestions are loaded on the client-side.
Technical Debt Removal
Impact: Medium
On top of the direct methods for page optimization where we introduce changes on top of what already exists, there is also the possibility of technical debt slowing down the page, for example, Redux, a common application state management library has gotten so big on the main website that it contributes to a large footprint for the application. We are actively reducing the footprint and also fixing a lot of bugs that the library’s usage causes in production.
Bundle Analysis Tools come in handy when trying to debug which chunks of your websites are large and non-performant. Most likely the framework that you use for building your web app provides bundle analysis tools built-in.
Prefetching Of Data
Impact: Medium
In most cases, transitions between two pages are not optimum (There are loaders and frozen pages during data fetching), in such cases, it is very helpful to prefetch the page in the background the moment the user comes near an action that causes a page change, this reduces load time for the pages significantly and gives the impression of an instantaneous page transition to the end-user.
Module Scoping
Impact: Medium
Load only the modules and data required to render the page. This ensures the user’s device is not bogged down processing data it does not need.
Unused JavaScript is a big issue with every website, and is very heavy on the browser given the browser has to load the bundle, parse it, execute it, processes that are heavier than Image rendering (Parsing and rendering a 100KB image is easier for the browser than parsing and executing a 10KB JavaScript bundle) and having all that effort go in vain isn’t ideal.
Loading Correct Font Format
Impact: Low
One part of the application load bundle that’s often ignored is fonts, however, many times heavy fonts or unoptimised fonts can cause the same amount of problems as heavy images. Updating our fonts to the woff2 format gave us a slight performance bump as it is lighter in size and works well with all browsers.
Impact Observed
We decided to apply the optimization methods to some of the highest footfall pages that we had, these include:
We’ve seen a good impact on the performance of the above-mentioned pages. The results we showcase below are all tested on an average 2MBPs connection, a standard for most smartphones and rural India users, a category of users Unacademy is proud to be enabling preparation for competitive exams.
Underlying the performance improvements for the affected pages, there are a few web vital metrics that have seen significant improvements for the pages on average:
This First Contentful Paint metric has seen the highest improvement, the pages tend to load in the first second for a high number of visitors due to them being pre-generated. For instance, FCP has seen an average improvement of 33% on average across the affected pages on slow internet connections. On fast internet connections, the difference is startling, for instance, we’ve seen 3x drops in FCP times on average.
Other metrics such as Largest Contentful Paint have also seen significant improvements on average, for instance, LCP on slow internet connections have seen improvements of ~50%.
We also give a lot of importance to LightHouse scores of webpages, and they were also one of the target areas for improvement for us, we have seen significant bumps in performance scores on Desktop for all these pages and are constantly going to try optimising further for mobile phones as well.
An Overview Table Of Desktop Performance Scores on Chrome DevTools Lighthouse with standard throttling enabled for some of the most visited pages on Unacademy post the improvements we made to those pages are mentioned below:
| Page | Performance Scores Before | Performance Scores After |
|---|---|---|
| Home Page | 85 | 99 |
| Goal Page | 60-70 | 85-92 |
| Free Lesson Page | 86 | 95 |
| Explore Goals Page | 90 | 98 |
| Educator Page | 63 | 92 |
Running Lighthouse on PageSpeed Insights or web.dev/measure however would not yield the same results due to geographical constraints (web.dev or PageSpeed insights hit our website from locations very far from our data centres in turn causing added latency, degrading performance scores)