At Unacademy, we use the EFK stack with forward and aggregate pattern for logs, Kubernetes events watcher for predicting potential scheduling or capacity problems, and plan appropriate optimizations of workload distribution. The Prometheus node-exporter monitors resource usage and provides metrics of our running containers. We utilize Kubecost to attribute cost to the services and improve resource utilization.
The Kubernetes Pod monitor tracks pods' failures and notifies them with captured crash logs. In this post, we want to open-source our in-house Kubernetes Pod Monitor and discuss its features.
The Problem
Kubernetes systems are quite lacking when it comes to their transparency and tracing abilities. The intermittent 502 and 504 errors on our microservices reflected this gap: several pod crashes went unnoticed until we were faced with a major availability outage in the event of concurrent map reads and writes in Golang.
To improve the monitoring of the Kubernetes pods, we were looking for solutions that focussed on:
- Send real-time pod crash alerts
- Capturing critical crash logs and persisting them in Elasticsearch
- Storing container state to have transparency over pod lifetime and status before its termination
- Slack integration for notifications
- Visualizing historical data trends
- Whitelist noisy namespaces
Why an in-house solution?
A few open-source solutions were evaluated before the inception of our in-house solution. We have documented the limitations of the alternative systems:
- Prometheus: The tool supports custom alerts but fails to capture critical crash logs.
- Kubewatch: It tends to be extremely noisy as it alerts each update in container state and fails to prioritize.
- Kube-slack: The tool alerts pod crash events but does not capture crash logs.
Our goal was to closely monitor pod failures, and retrieve the crash logs while ensuring the simplicity of the entire workflow. During our exploration of existing solutions, some tools were either too noisy while others failed to capture crash logs making it difficult to troubleshoot.
Introducing Kubernetes Pod Monitor
The Kubernetes logs are lost whenever a pod crashes and reschedules on a different node. The process of extracting those logs involves pod tracking and previous state log retrieval which is quite time-consuming and cumbersome.
To combat this problem, we built our in-house Kubernetes pod monitor. The service is implemented in Golang which allows it to be highly scalable, efficient, and fast. It uses Kubernetes API to track container failures and automatically sends the crash logs to Elasticsearch for debugging. It is integrated with Slack to notify failures and send messages with details like the last container state, the reason for pod failure, and a direct link to the crash logs storage.
Sample slack notification:
Cluster Name:- k8s-01
Namespace:- kube-system
Container Name:- node-exporter
Reason:- OOMKilled
Kibana Dashboard:- Dashboard
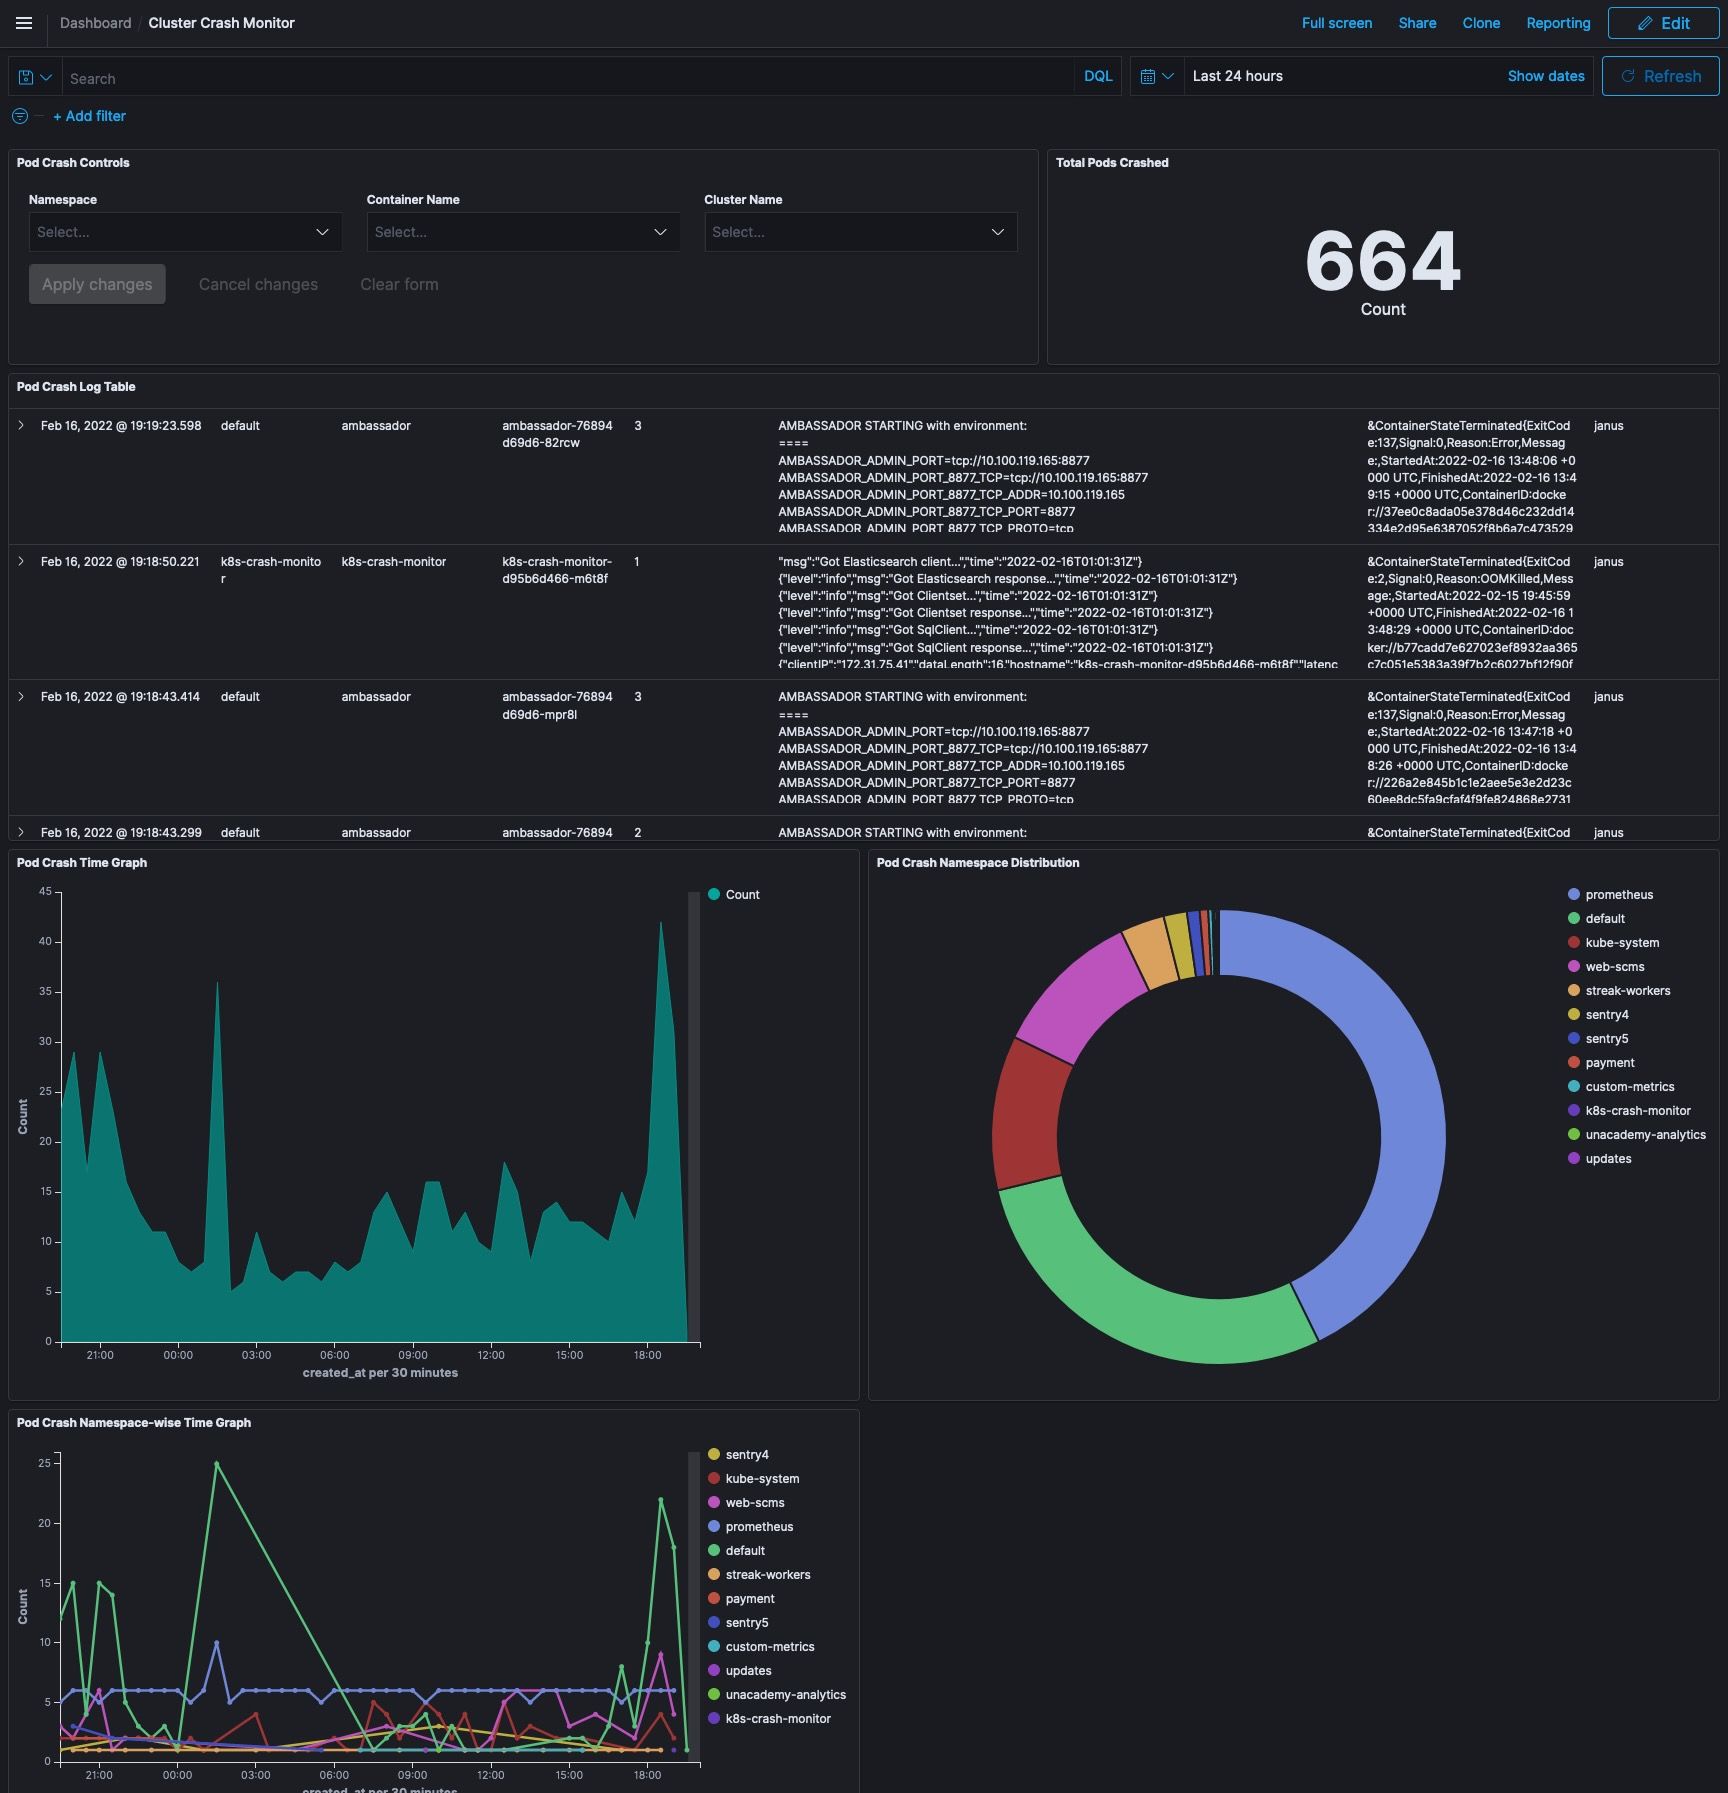
A detailed Kibana dashboard is designed to track the cluster/service experiencing high failure rates and visualize its trends:
The Impact
We observed a 65% reduction in unexpected pod restarts after the deployment of our monitoring solution. Mean time to detect (MTTD) and Mean time to repair (MTTR) improved significantly, therefore, ensuring high availability and seamless troubleshooting. Even when everything is seemingly fine with our Kubernetes clusters, the service continues to highlight issues that would have otherwise gone unnoticed and unattended.
Kubernetes pod monitor also helped streamline deployments as any pod crashes are immediately notified.
Getting started with Kubernetes Pod Monitor
We are open-sourcing our Kubernetes Pod Monitor and the installation process is very simple and available using Helm chart or docker-compose. The detailed steps are enlisted here: https://github.com/Unacademy/kubernetes-pod-monitor#getting-started
Using Helm chart (recommended):
- Apply MySQL migrations
- Install using the Helm chart
- Import the Kibana dashboard into Elasticsearch by following https://www.elastic.co/guide/en/kibana/current/managing-saved-objects.html
Using docker-compose:
- Add Kubernetes configuration (kubeconfig) file to
configdirectory and updateCLUSTER_NAMEenv variable in docker-compose - Start docker-compose using:
docker-compose up --build
To configure slack notifications, a CLI tool can be used for simplicity: https://github.com/Unacademy/kubernetes-pod-monitor#configuring-notifications
What’s Next for Kubernetes Pod Monitor?
Kubernetes Pod Monitor dramatically simplified our engineering and reliability processes. This setup helped increase transparency in Kubernetes and ensured that pod failures don't go unnoticed. A direct impact was higher availability, reduced MTTD, and improved developer productivity.
But why stop here? There are other events to monitor like scheduling failure, image pull error, etc, integrations with Pagerduty, Discord, etc.
