Learners excel when they practice, but there are times when they are stuck and they need help to understand. To resolve any and all the doubts of our learners, we launched a feature that we call Ask a Doubt. There are hundreds of thousands of doubts asked on our platform every month and to solve this problem efficiently and at scale, we leverage AI.
As the doubts are solved, their solutions are stored in a repository. This is done to optimize the cost and turnaround time for the learner. The next time this doubt is asked, we serve it from this repository, rather than solving it again. To relieve the pain of having to type in the doubt, we chose to enable asking a doubt via images. While this makes the process much easier for learners, it adds an additional challenge for us to decipher the exact doubt and match it with the already solved doubts in our repository.
There are pre-existing algorithms in the OCR (Optical Character Recognition) domain that are effectively designed to detect and extract data from an image. These algorithms work well for images that do not have mathematical symbols, chemical equations, and diagrams.
However, for our use case, the image data received may contain expressions, formulae, numbers, mathematical symbols, chemical equations, and diagrams in addition to the question text. We observed that the OCR systems translate these into garbage characters which hamper our doubt matching accuracy from the repository. In the example shown below, clearly, the symbol for theta and exponents used in the mathematical expression is either converted to garbage characters or are left undetected. This results in the learner's question being wrongly matched.
Here are a couple of images and the text recognized from them.

19. Minimum value of 5 sin + 4 cos? O is - (A)1 (B)2 (C)3 (D)4
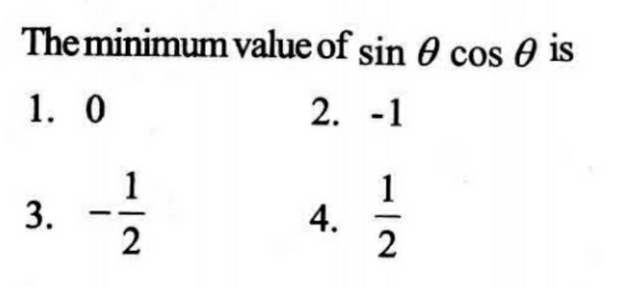
The minimum value of sin cos O is 1. 0 2. - 1 1 1 3. 4. . 2 2
In the text extracted from the images, we see that there is a massive loss of information. Mathematical expressions do not even hold their shape, let alone symbols. This implied that we cannot use this out-of-the-box solution, and required us to use a hybrid approach.
Our approach
To simplify our work in matching, we try to match different parts of the image separately. e.g. matching a mathematical symbol with the symbol part in the existing question, question text with the existing questions' text in our corpus.
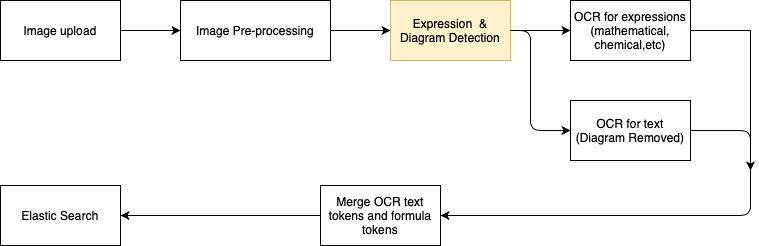
The sequential steps involved in solving this are:
- Pre-processing of the image received
- Object Detection to find relevant objects (mathematical expressions, chemical equations, diagram, etc.) in the image
- Extraction of text from objects like "Problem"
- Searching for a match from the known problem corpus
- And finally fetching the corresponding answer to the matched question
We will focus on #2: the Expression and Diagram Detection step, in this blog.
Expression and Diagram Detection Task
As discussed above, the goal is to come up with a way to detect the different types of data that may be a part of a doubt image. This boils down to employing Object Detection and Classification algorithms.
Given an image, we would ultimately want the algorithm to create bounding boxes around the objects of interest (expressions and diagrams) and classify them into one or more pre-decided classes/categories.
We approach this as a Supervised Learning problem by tagging some doubt images ourselves to create the labeled dataset. Also intuitively, we would want the algorithm to 'see' or scan the image and somehow 'point at' the mathematical expression, chemical equation, formula, or diagram by marking them.
With both these considered, the algorithms we discuss fall in the paradigm of 'vision-based supervised learning methods. We choose Multilayer CNNs (Convolutional Neural Networks) as our preferred method as they have been fairly successful at solving such problems.
Data Exploration and initial steps
We observed that the match score for the questions with a mathematical expression, chemical equation, and/or a diagram typically doesn't find a match from the database, even though such a question is present in the corpus.
We label the images in YOLO format by drawing bounding boxes in the image. We label ~4000 images (most of which didn't find a match from the corpus) with bounding boxes on 2 classes: Expression (f) and Diagram (d)
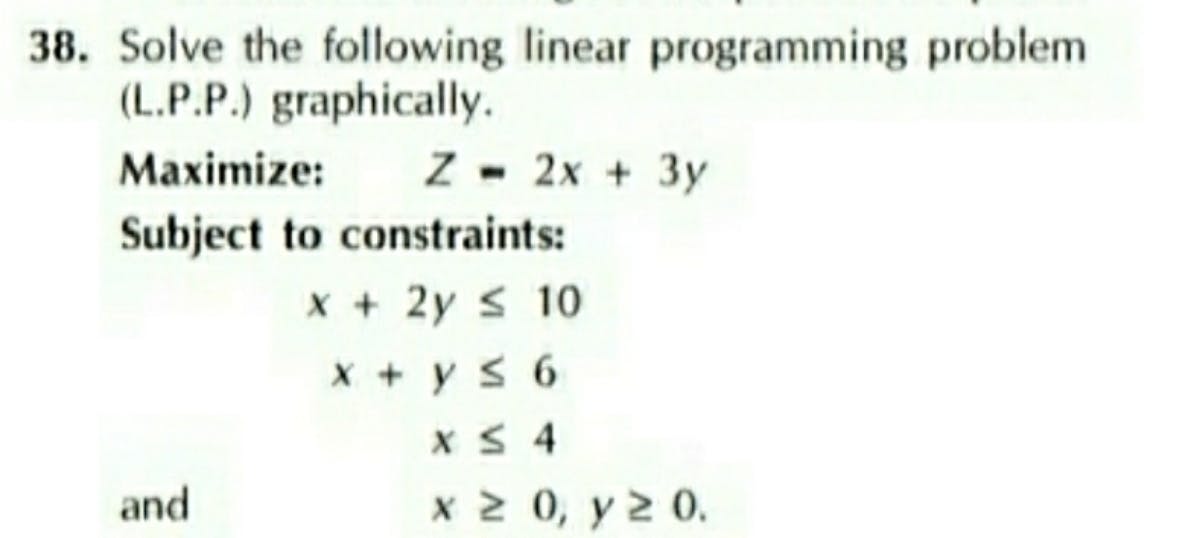
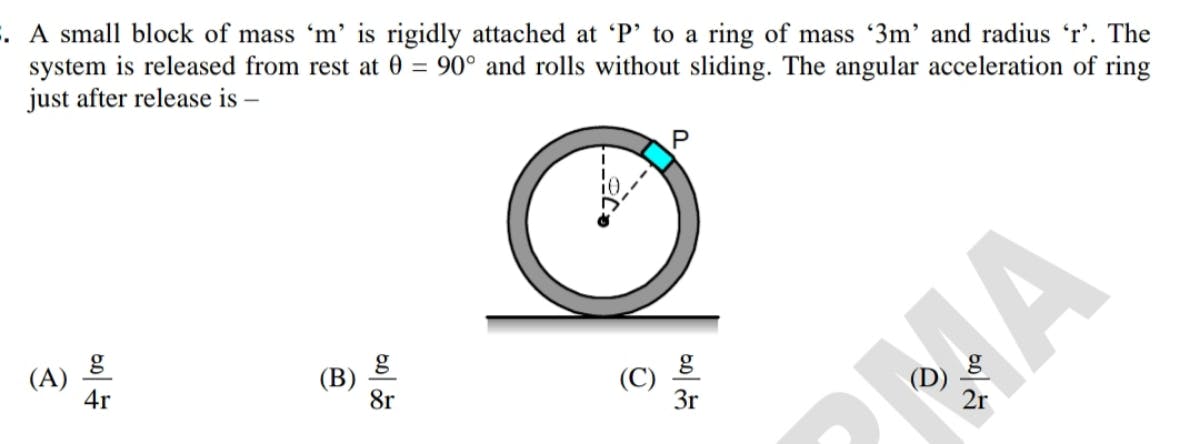
Some sample images from the image set we worked with:
We also label each Expression or Diagram originating from physics, mathematics, chemistry, and biology, which gives us 8 additional classes:
- Expression from physics
f_p - Expression from maths
f_m - Expression from biology
f_b - Expression from chemistry
f_c - Diagram from physics
d_p - Diagram from maths
d_m - Diagram from biology
d_b - Diagram from chemistry
d_c
The two sets of labeling (discussed above) help us execute multiple classification strategies and run more experiments to determine the best strategy. We employ 2-class and 10-class classification which will be discussed further.
The image below, shows the label distribution over the training data for 2-class classification:
(Class 0 - Expression class, Class 1 - Diagram class)
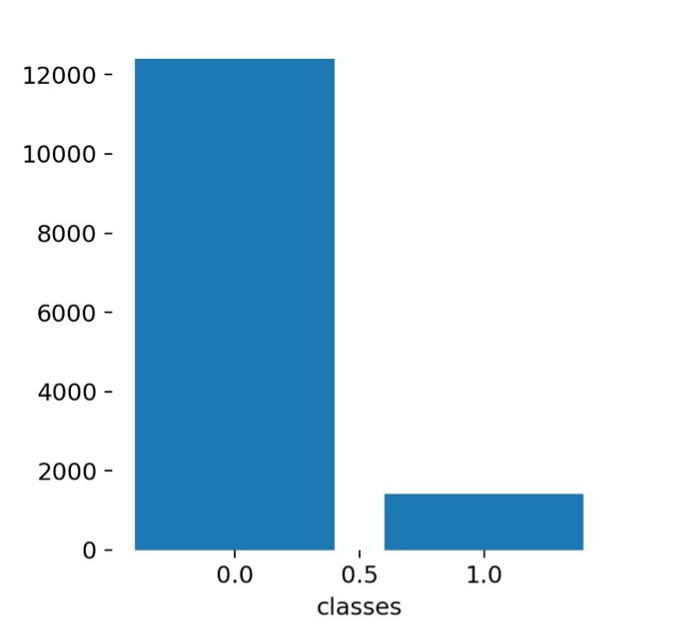
The class label instance ratio did not have a significant impact on the results, hence we didn't do the class balancing. If there's a significant class imbalance affecting the results, we can use a few strategies to overcome it, e.g. minority class oversampling, majority class under-sampling, data augmentation, class weighing, etc.
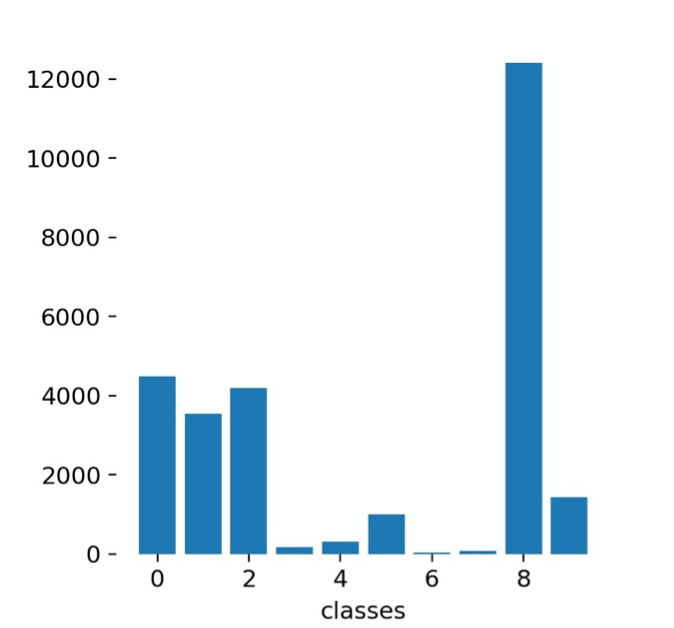
The image below, shows label distribution for 10-class classification:
Experiment Details
We take the help of our eyes to see everything; it captures the information in the frame and sends it to our brain to decode and draw meaningful inferences from it. This is the basic intuition behind all the computer vision-based Object Detection algorithms. The Object Detection algorithm we employ belongs to the YOLO (You Only Look Once) family.
We choose YOLO because,
- The YOLO family of models processes images in real-time at a much faster fps as compared to recent to other state-of-the-art detection techniques while giving better or on par mAP scores
- Furthermore, YOLO makes more localization errors but is far less likely to predict false detections where nothing exists
- Finally, YOLO learns very general representations of objects
YOLO architecture:
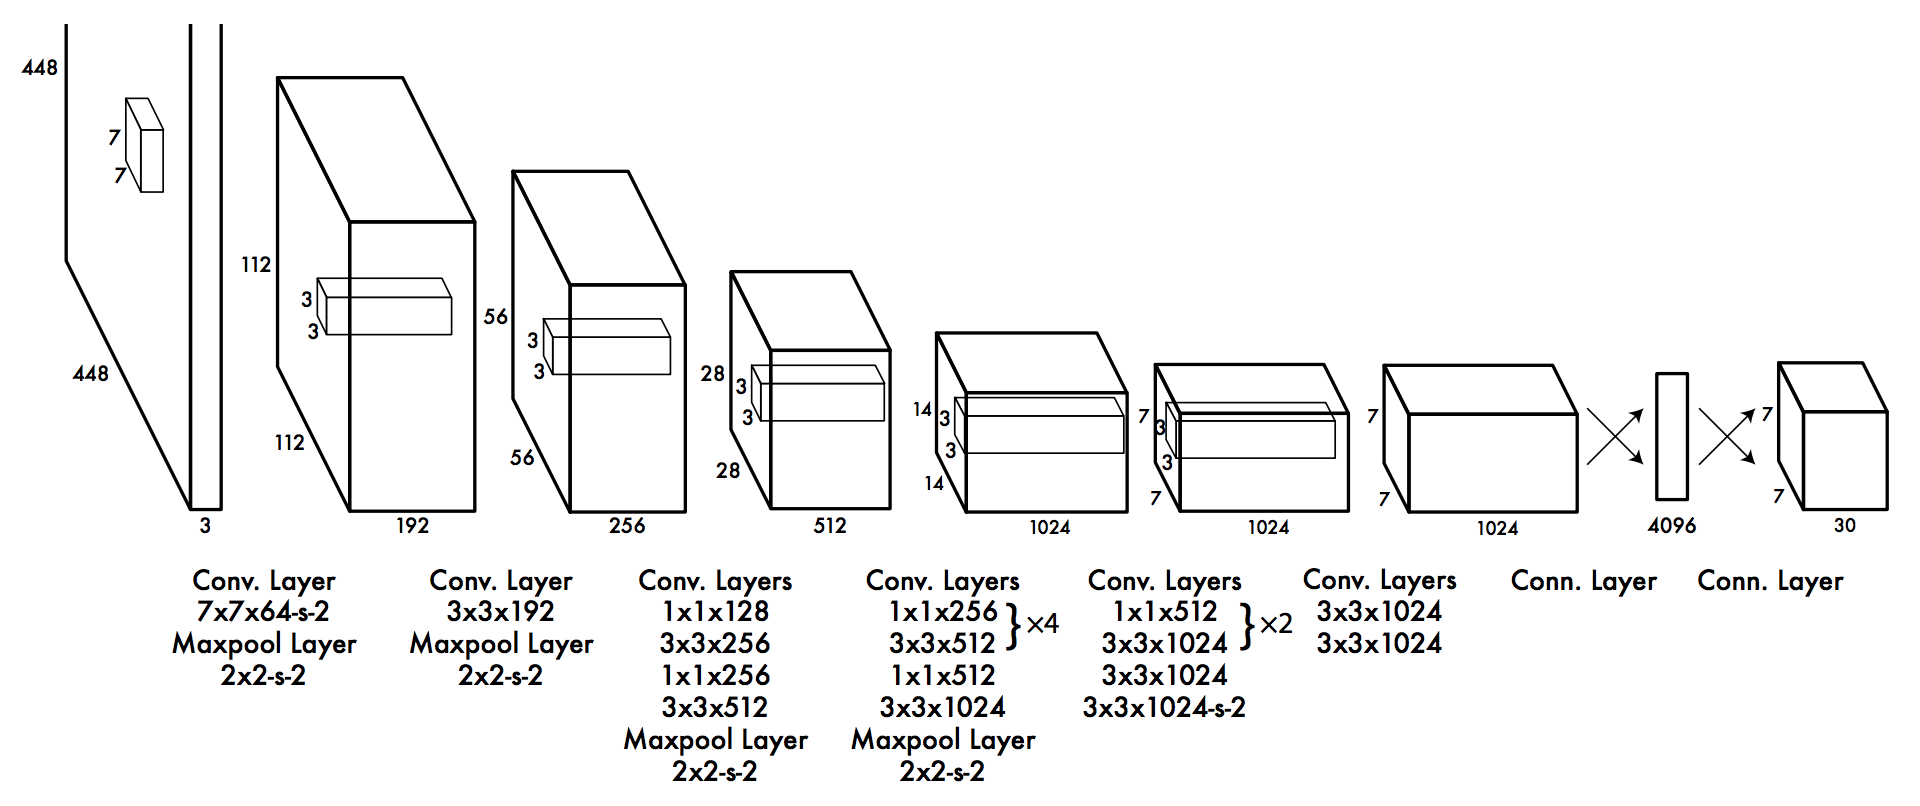
(Image source: https://arxiv.org/pdf/1506.02640.pdf )
We deal with YOLOv5 and its subtypes (small, medium, large). These subtypes are differentiated based on model network size and the number of learnable parameters.
The initial run was done on a lesser dataset of ~2k images which were later increased to ~4k to achieve substantial performance improvements.
The 2-class classification strategy is tested first and then 10-class classification is delved upon. All models are trained on GPU for faster training. The GPU used was a 64-bit NVIDIA Tesla K80 arranged with CUDA 10.2.
Various experiments were conducted with a different set of hyper-parameters (initial learning rate, batch size, epochs, etc.) for the two modeling strategies involving three models to tune the hyper-parameters. These hyper-parameters worked the best for the 2-class classification:-
lr_initial: 0.01
momentum: 0.937
weight_decay: 0.0005
epochs: 100
batch_size: 16
Results
Multiple experiments with each type of model are conducted and the results for the best models for the two approaches are plotted below. Since it is an object detection task, the mAP (mean Average Precision) score is used as a metric. The closer the mAP value is to 1, the better the detection.
2-Class Classification
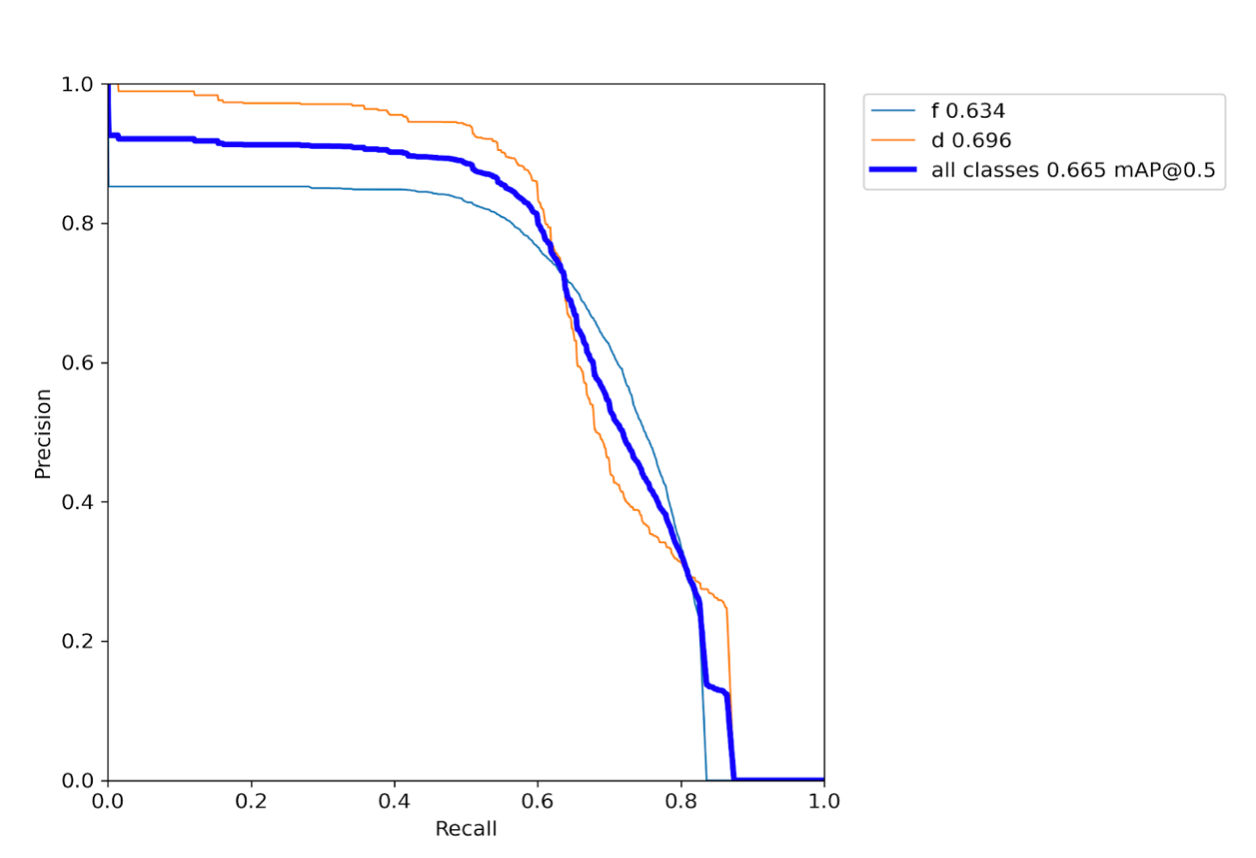
We started by training the model on the smaller dataset of ~2k images. The precision-recall curve for validation dataset for 2-class classification model (Yolov5 small) trained on ~2k images:
The precision-recall curve for validation dataset for 2-class classification model (Yolov5 small) approach trained on ~4k images:
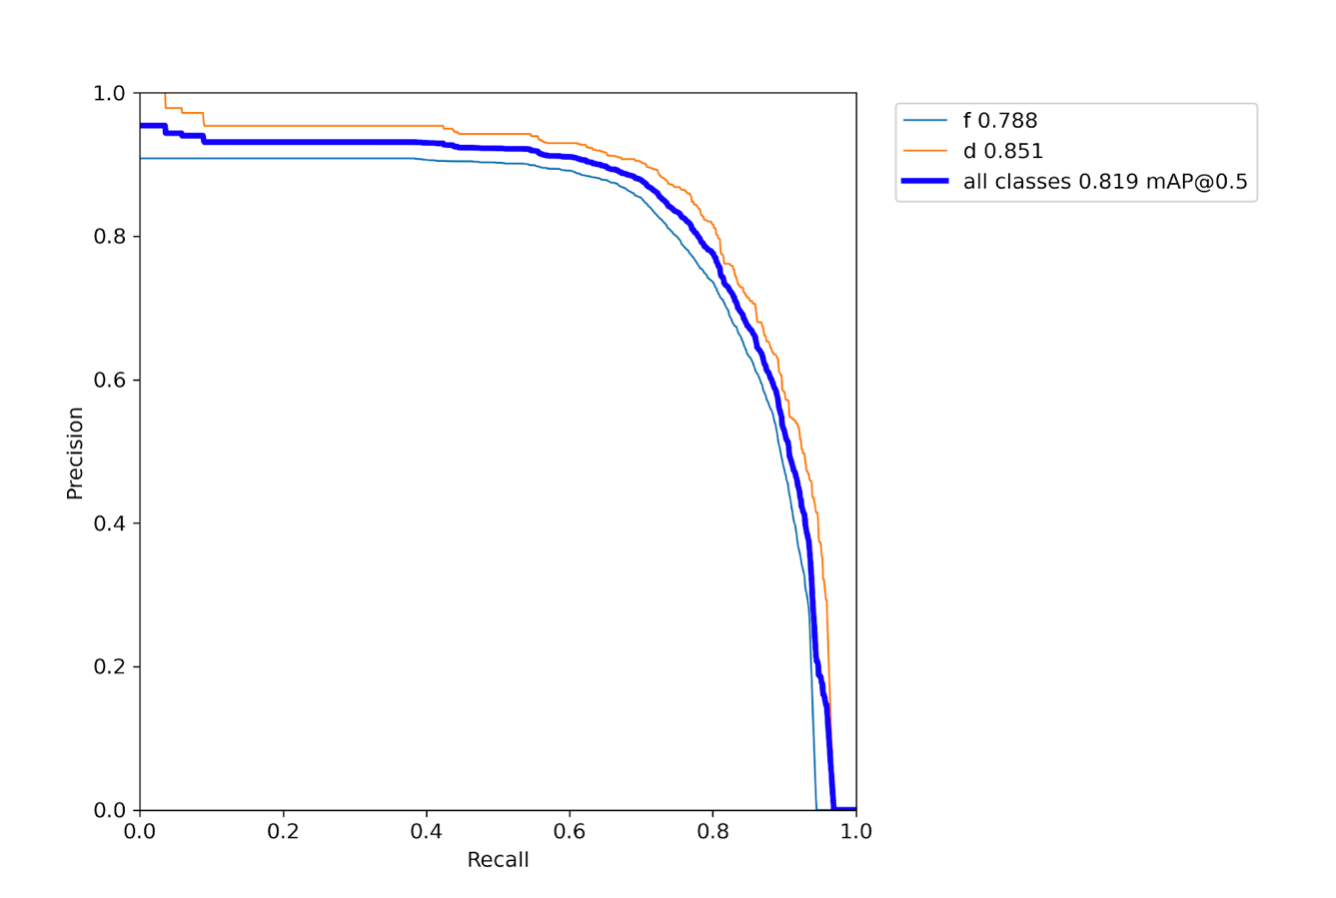
We observed that an increase in the training data does improve results. Evident from the figures above, the mAP score on the validation dataset for the model (Yolov5 small) trained on ~2k images is only 0.665 as compared to 0.819 in the latter case (same model trained on ~4k images).
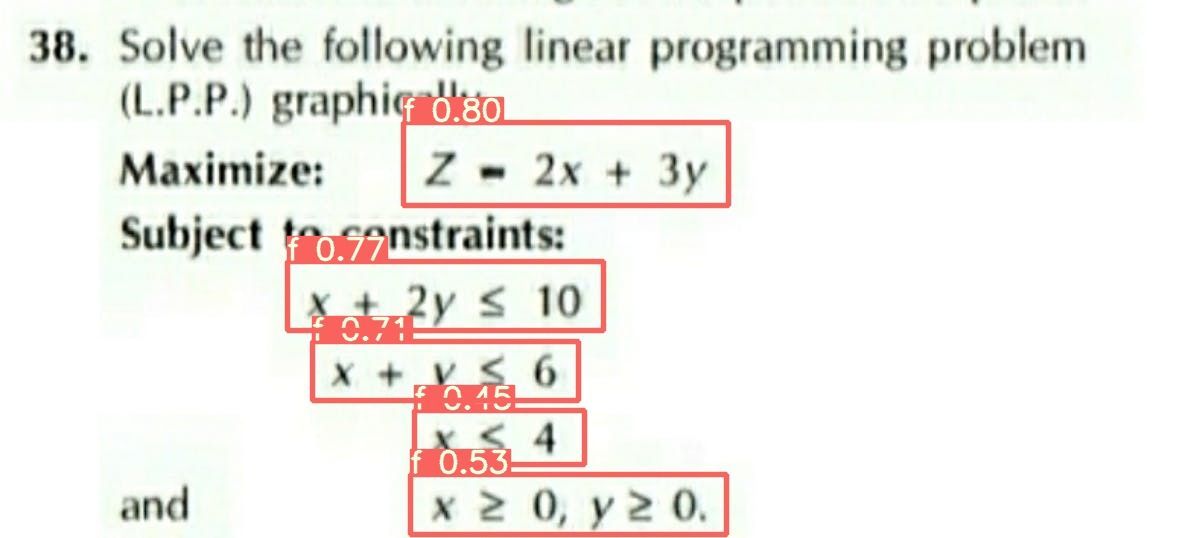
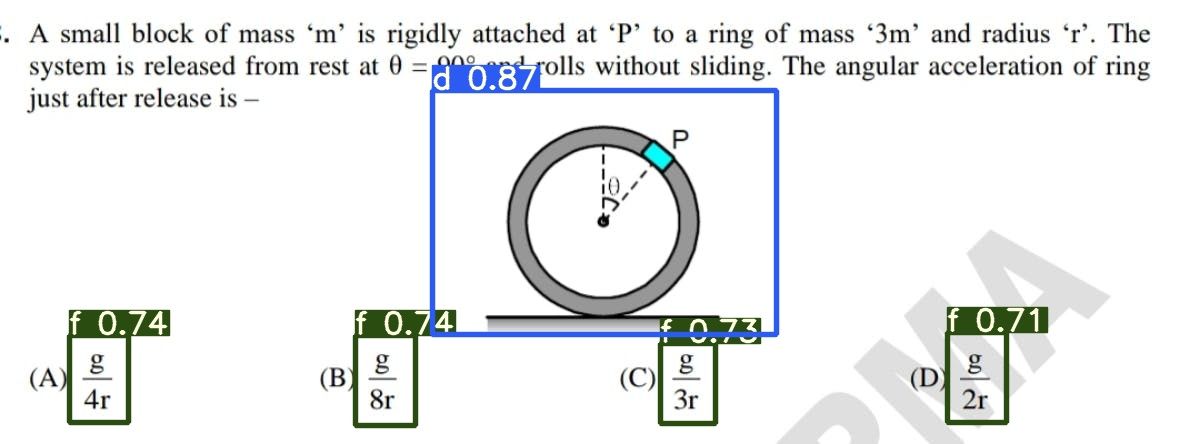
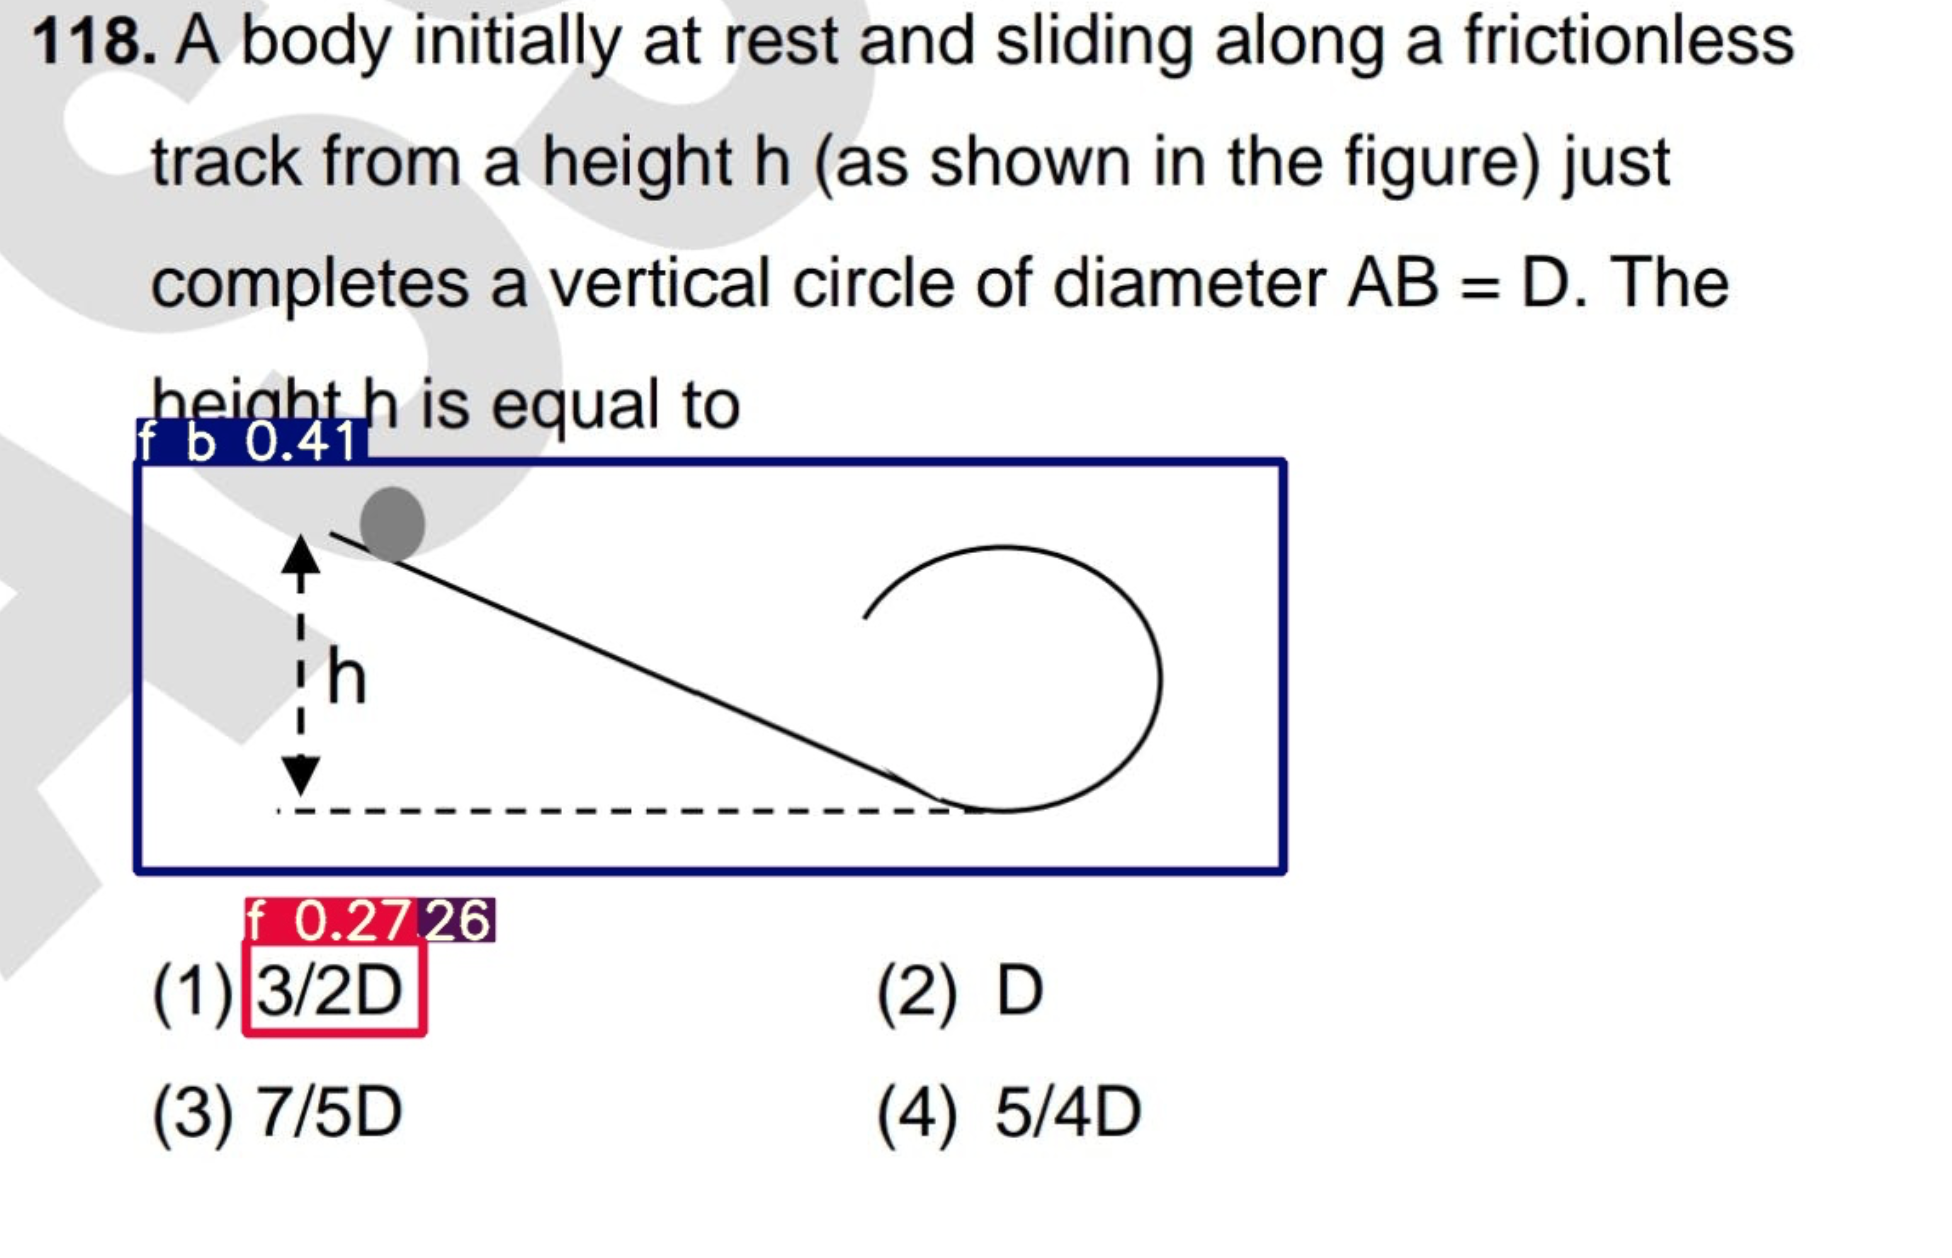
The following images depict sample inferences for the 2-class classification. It is observed that the bounding boxes are accurately positioned in most of the cases with high probability/confidence scores for the assigned class.
On average, the inference time taken by the algorithm per image is 35ms.
Predictions on the previously mentioned sample images:
10-Class Classification
We also tried the 10-class classification expecting to infer two bounding boxes per detected object. One bounding box with the umbrella class tag (either f or d) and another bounding box with one of the subclass tags (f_m, f_c, f_p, f_b, d_m, d_c, d_p, d_b).
The precision-recall curve for validation dataset for 10-class classification model (Yolov5 small) trained on ~4k images is as follows:
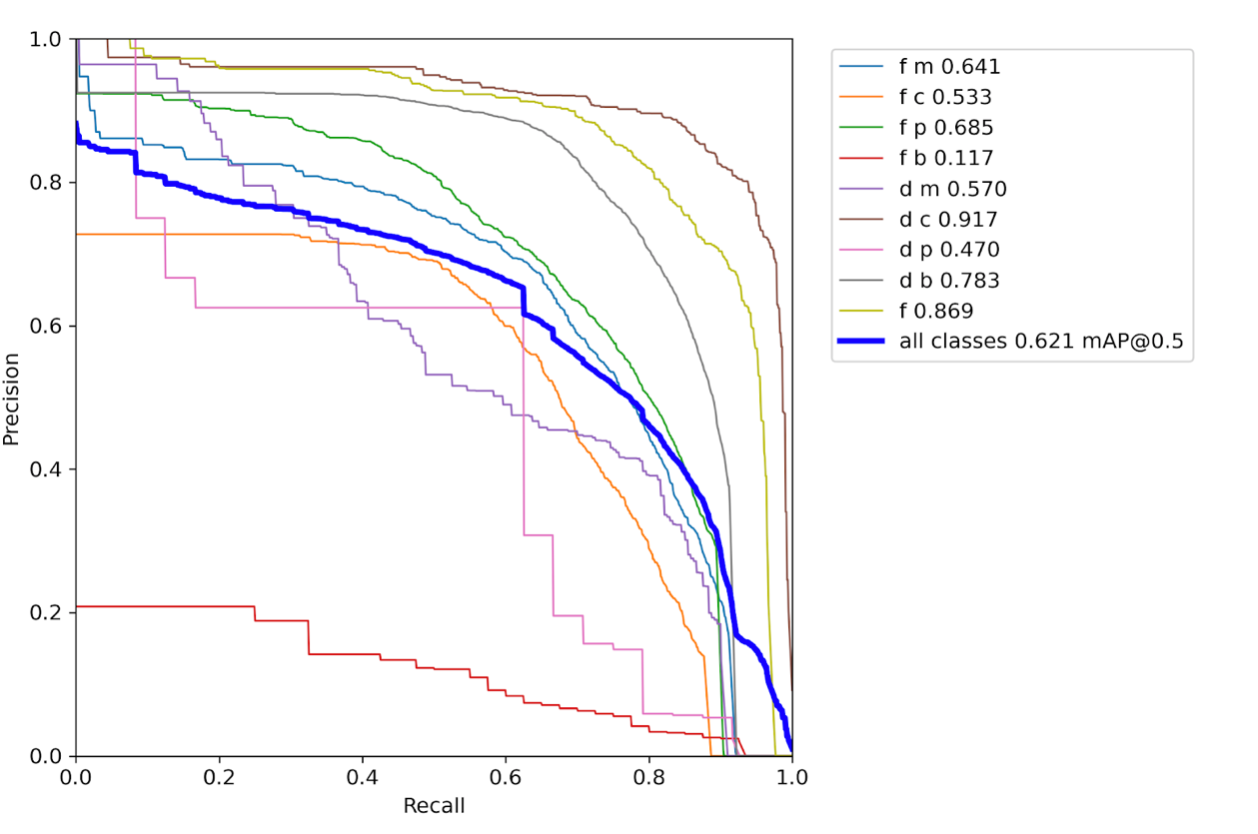
Though the mAP for all classes is 0.621, there are a few edge cases that emerge as a result of lesser mAP for some classes.
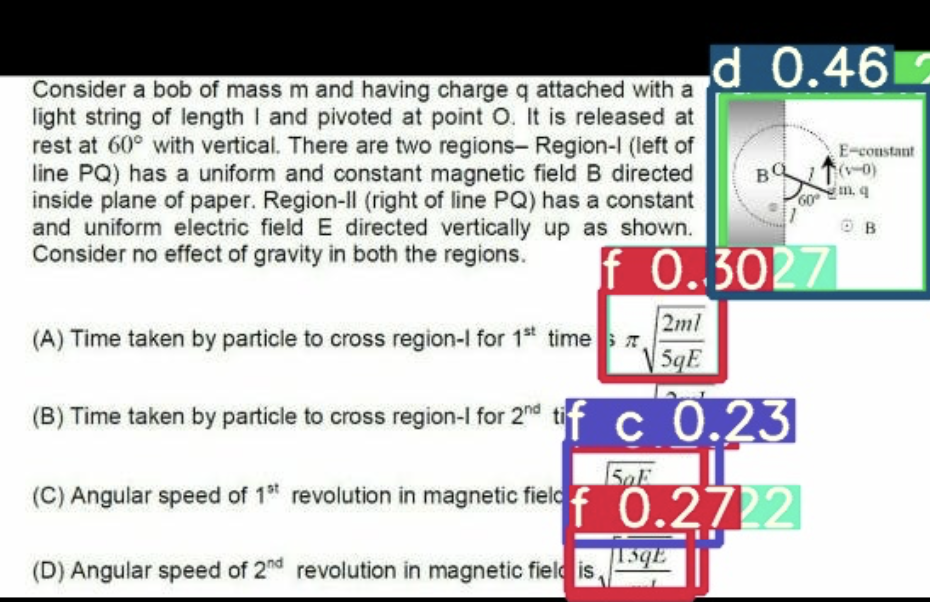
Shown below are a few of these edge cases, where the label predictions are wrong at the sub-class level. It is important to note the lesser confidence score associated with these label predictions which can be attributed to the fact that there is substantially less tagged data for these classes in the training set, something which we aim to mitigate in future trials. The class(expression from biology) f_b is predicted for a diagram belonging to physics. Also, in the next image, the class f_c is predicted for an expression which ideally should have been predicted as f_p (expression from physics).
Edge Cases:
The table below shows the experimental results for the different models trained on ~4k train image dataset:
mAP scores for different models for a run of 100 epochs each during training
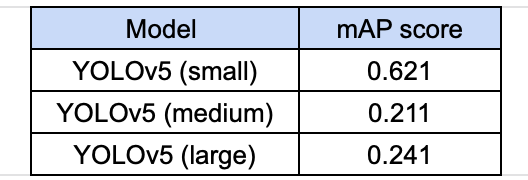
It was observed that further increment of epochs results in the problem of overfitting. The low accuracy for the medium and large YOLO models is perhaps due to a dearth of train data in comparison to the significantly large number of learnable parameters present in both these models.
Work Ahead
The 2-class classification model is observed to have acceptable accuracy for the test examples. The next step of achieving a good doubt matching accuracy is a focus on OCR for expressions.
As far as 10-class classification is concerned, it seems to be a 'high-variance, low-bias model as there is scope for performance improvement on increasing the training data substantially. We observed cases where f and d tags are detected correctly but the subclasses tags (f_m, f_p, etc) are not. The probable cause of this issue is the presence of fewer data per subclass or little dissimilarity between (say) physics and chemistry formulae. Similar is the case for diagram sub-classes. The addition of more tagged data in the train set is expected.
A sequential way of classification can also be experimented with, where the umbrella classes - f and d are detected in the first step and then the subsequent model looks only at the bounding boxes already created, to detect the sub-class.
Occlusions in the incoming images cause extra/false detections at times which may hinder the overall accuracy of the pipeline. These image-related occlusions include - contrast, intensity, resolution issues. In addition, there are also cases of handwritten learner markings (pen/pencil) on the image. We can use Image preprocessing techniques like histogram equalization, contrast adjustment, pixel adjustments for noise reduction, etc to resolve these.
Further, it remains to be seen how other Object Detection algorithms perform for our domain-specific use case. Some approaches like EfficientNET, RCNN, Faster RCNN can also be explored.