Building a good user interface is easier but building a good user experience, which is aligned with business metrics, is much harder.
In the Unacademy android app, everything which our users do, from signing up to watching lessons to plans and payments is governed by a set of A/B experiments.
What is an A/B experiment?
As per Wikipedia
A/B testing is a user experience research methodology. A/B tests consist of a randomized experiment with two variants, A and B. It includes application of statistical hypothesis testing or “two-sample hypothesis testing” as used in the field of statistics
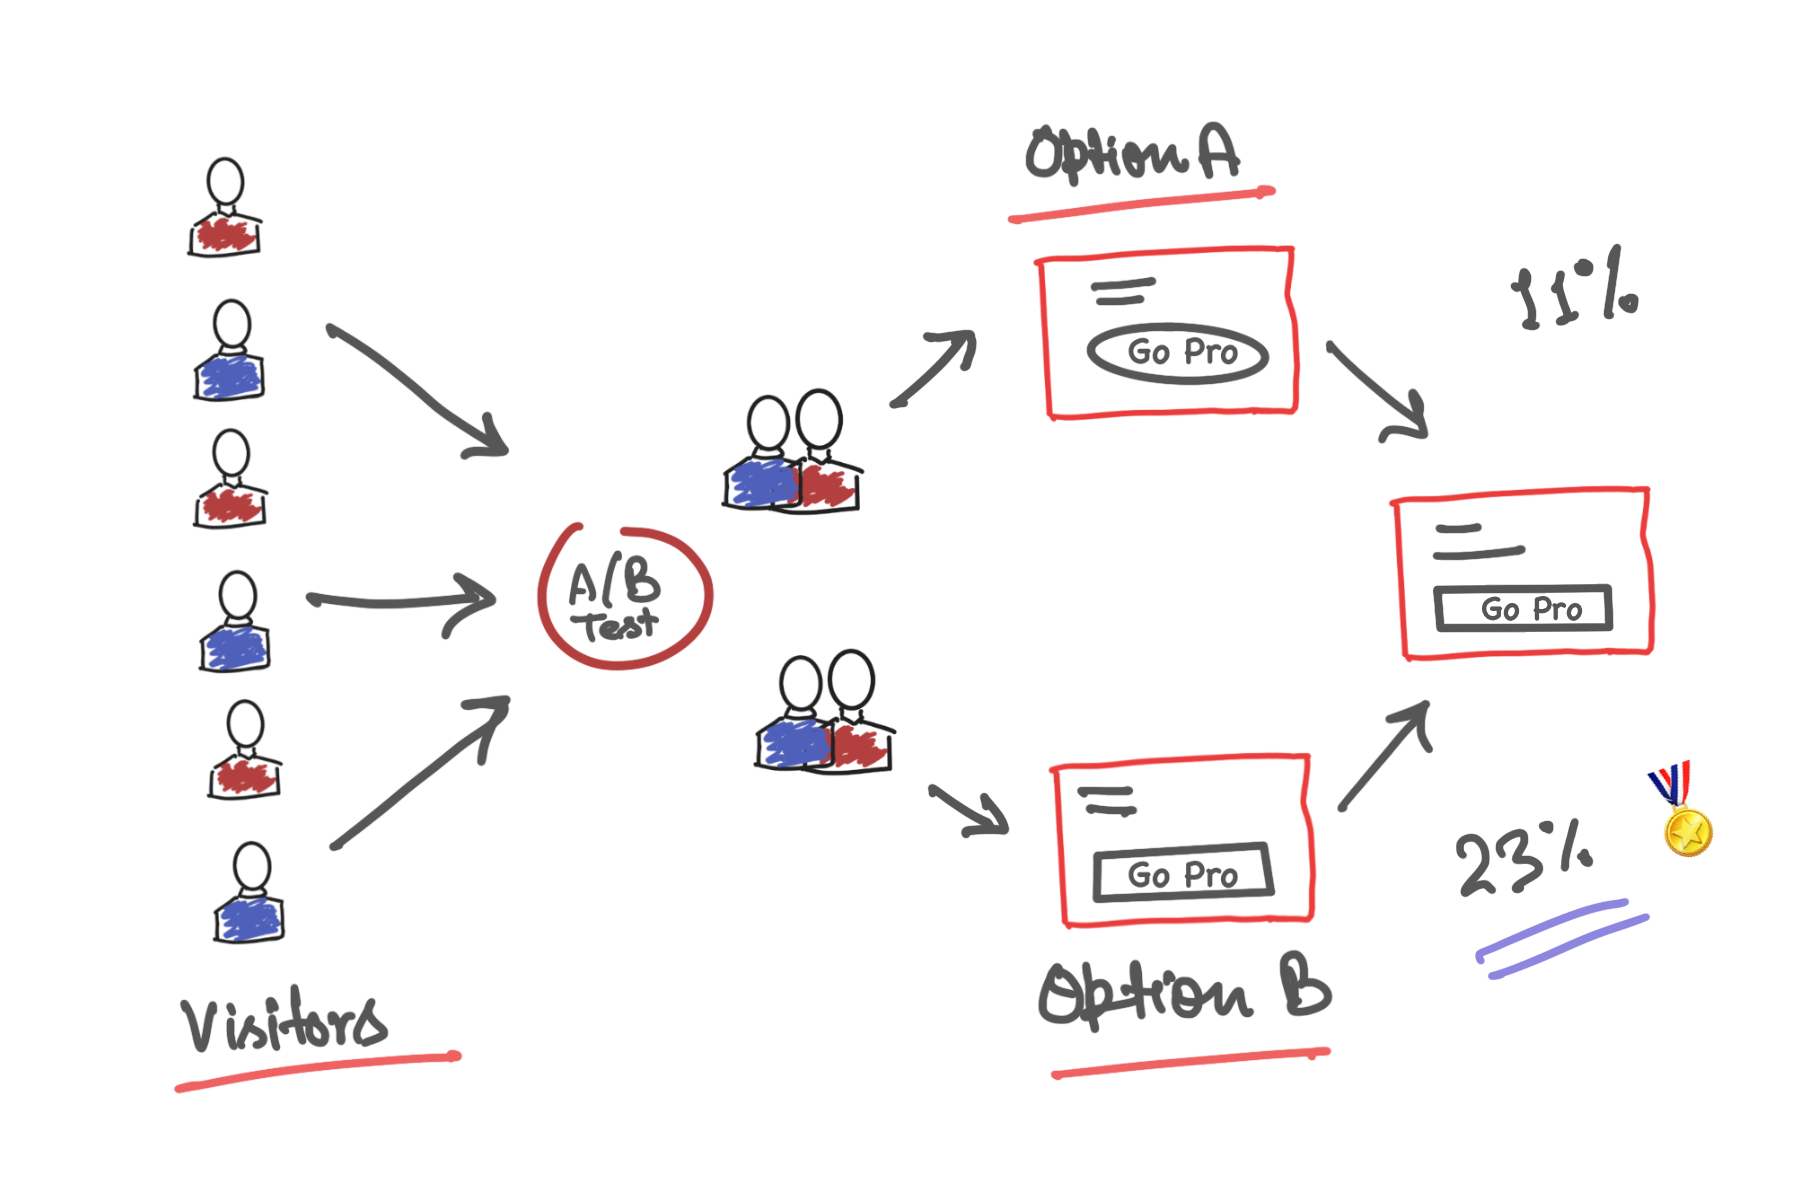
To put it simply, A/B Experiment is a way to check the relative effectiveness of two or more possible solutions, to solve the same problem. The impact of each variant is measured against each other and the current version, known as Control. Experiments are generally run, till we have a conclusive winner based on target metrics. After which, the most optimal solution is picked and marked as Control(default variation).
One can consider the whole A/B framework as like a data-driven Sorting Hat. This hat helps you, in deciding what works for you, Gryffindor(Test1) or Slytherin(Test2), based on data. The experiment will be run against your current persona i.e., the Muggle form(Control).
A/B experiments are regularly used in various fields like digital marketing, politics, product pricing, growth-engagement funnel optimizations, etc. Let's talk about how we run them at Unacademy.
Anatomy of A/B Experiment
Let’s first talk about the basic building blocks of an A/B experiment to understand the whole process. To run an A/B experiment you need to solve two problems.
Creating experiment buckets
Figure out how to assign users to mutually exclusive experiment buckets. The user selection has to be unbiased and test groups should be consistent.
A/B can be run in any variation ratio you want, for example, the Test1 variant can be opened for 20% of people while the rest of 80% can still use the current Control variant, the results are measured relatively. This kind of A/B, where the test group is not split equally helps with running critical product funnel experiments like payments, where you want to minimize the impact of the experiment for the majority of the users.
Measuring the impact
The second problem is to measure the impact. We take the help of our analytics infrastructure to analyze the impact of various experiments we run. To aid this, we cover all product funnels with an exhaustive set of events.
We consider an experiment successful if it gives expected results with very high statistical significance. Statistical significance refers to the claim that a result from data generated by experimentation is not likely to occur randomly or by chance but is instead likely to be attributable to a specific cause. For example, if you run an A/B testing experiment with a significance level of 95%, this means that if you determine a winner, you can be 95% confident that the observed results are real and not an error caused by randomness. It also means that there is a 5% chance that you could be wrong.
We use our internal tool called Mosapp which takes care of user bucketing and lets us see the impact.
Let’s go through a few case studies to see how A/B Experiments are shaping our product.
Call to action Experiments to improve discoverability of classes
This experiment was done to improve class discoverability for our learners. The area of the experiment was a class carousel, where we show top trending classes. We were giving the users an option to watch all available classes via the "See all free classes" button. Our goal was to increase the number of user clicks on this button.
We experimented on two design variants against our current Control variant. Our Test1 was consistent with the rest of our UI components on the same page and Test2 had the same button with a thin border. The experiment was run for all the users in equal proportion i.e. 33.3% of users were shown each of these options.
These were the CTA click numbers for the experiment period.

Test2 was the clear winner with 99.75% statistical significance.
Learning: Making things more clickable by using borders works better for us.
Copy experiment to improve value offer understanding of plans
Like any other digital service startup, we have our plans page where we list down our plus plans with different monthly options to pick from. In the Control variation, we used to show the price of full course duration.
The hypothesis of this experiment was to emphasize per month pricing to make the learner understand our value offering better. This experiment was run with Control and Test variants and users were divided equally between variants.
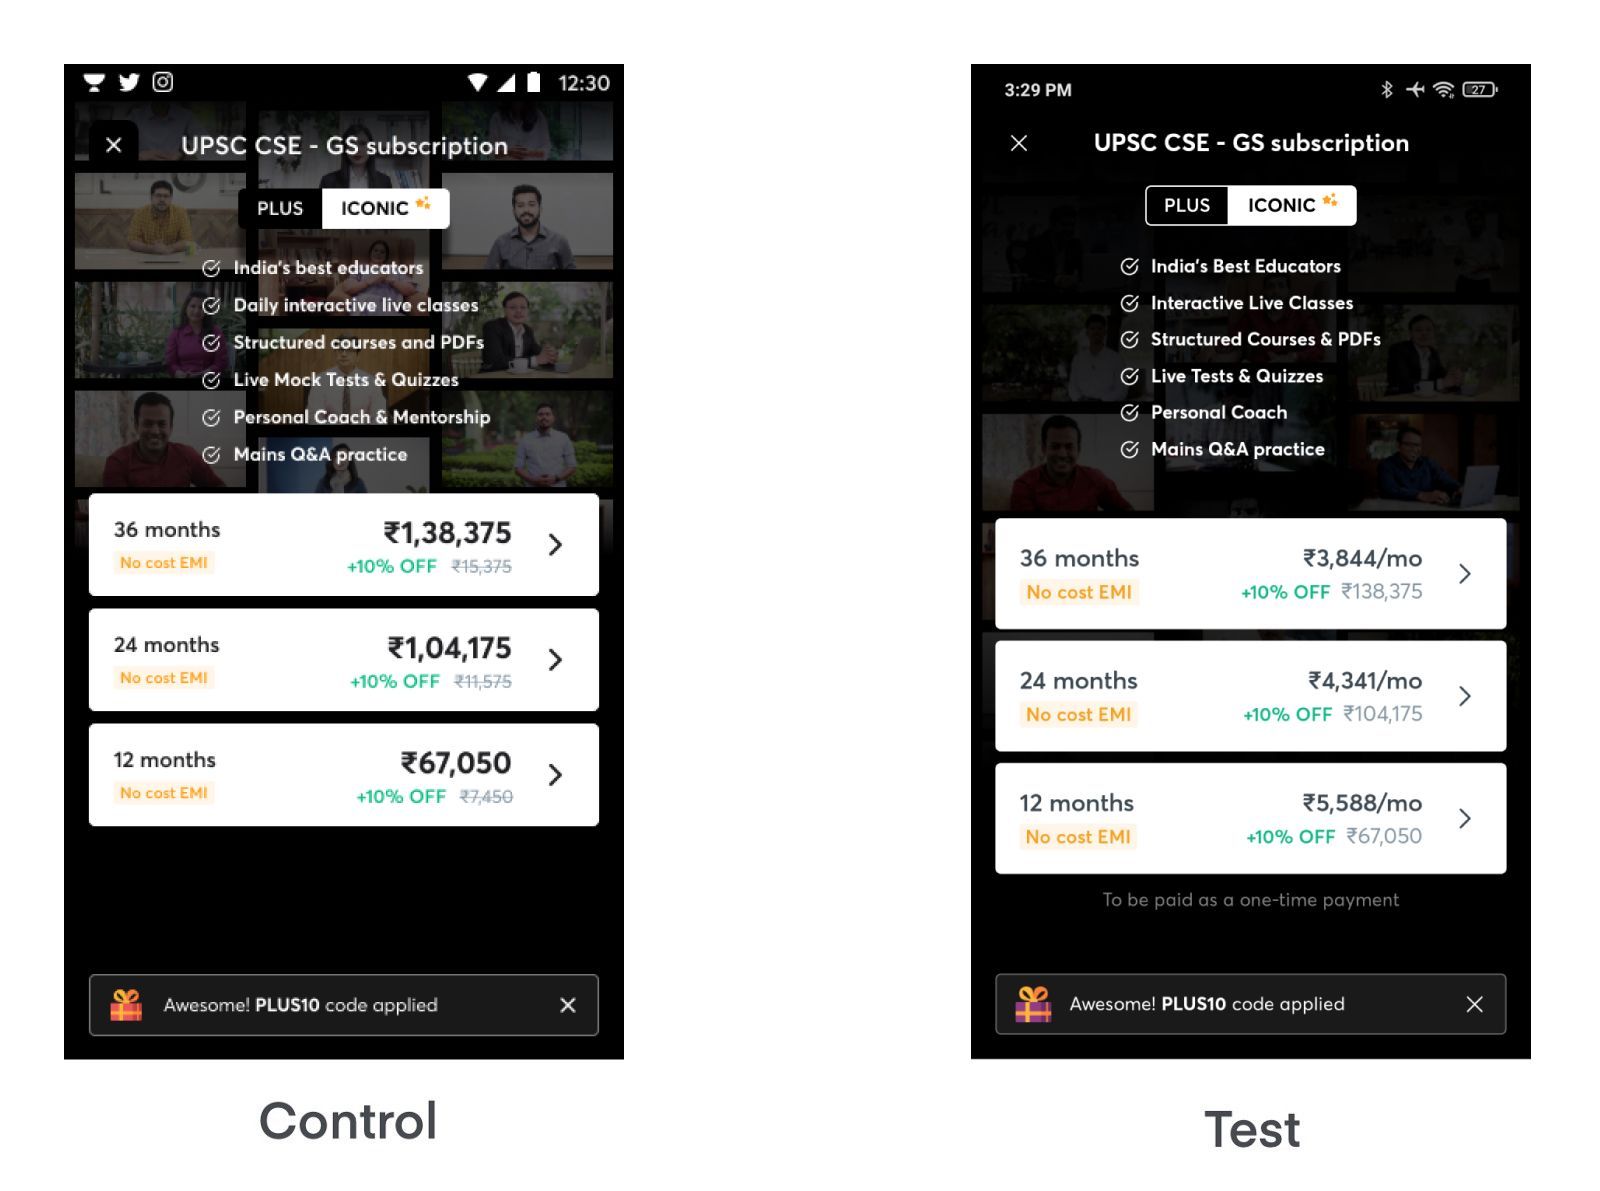
Test variation had a 13.5% more click-through rate with 100% significance.
Learning: Prioritizing per month pricing copy worked better for us, and the Test version conveys our value offering better.
Usability experiment to improve the onboarding experience
We use Truecaller as one of our login methods. Truecaller pops a modal to prompt the user for sign-up or login. The app has two options to show prompts as Dialog or Bottom sheet. As you can see from the screenshots there are no additional CTAs or flow, so it should not affect any onboarding numbers significantly.
The hypothesis was, that devices are getting bigger and bigger, and using the bottom sheet is better over dialog in terms of UX, as in the bottom sheet, buttons will be more reachable and easier to click.
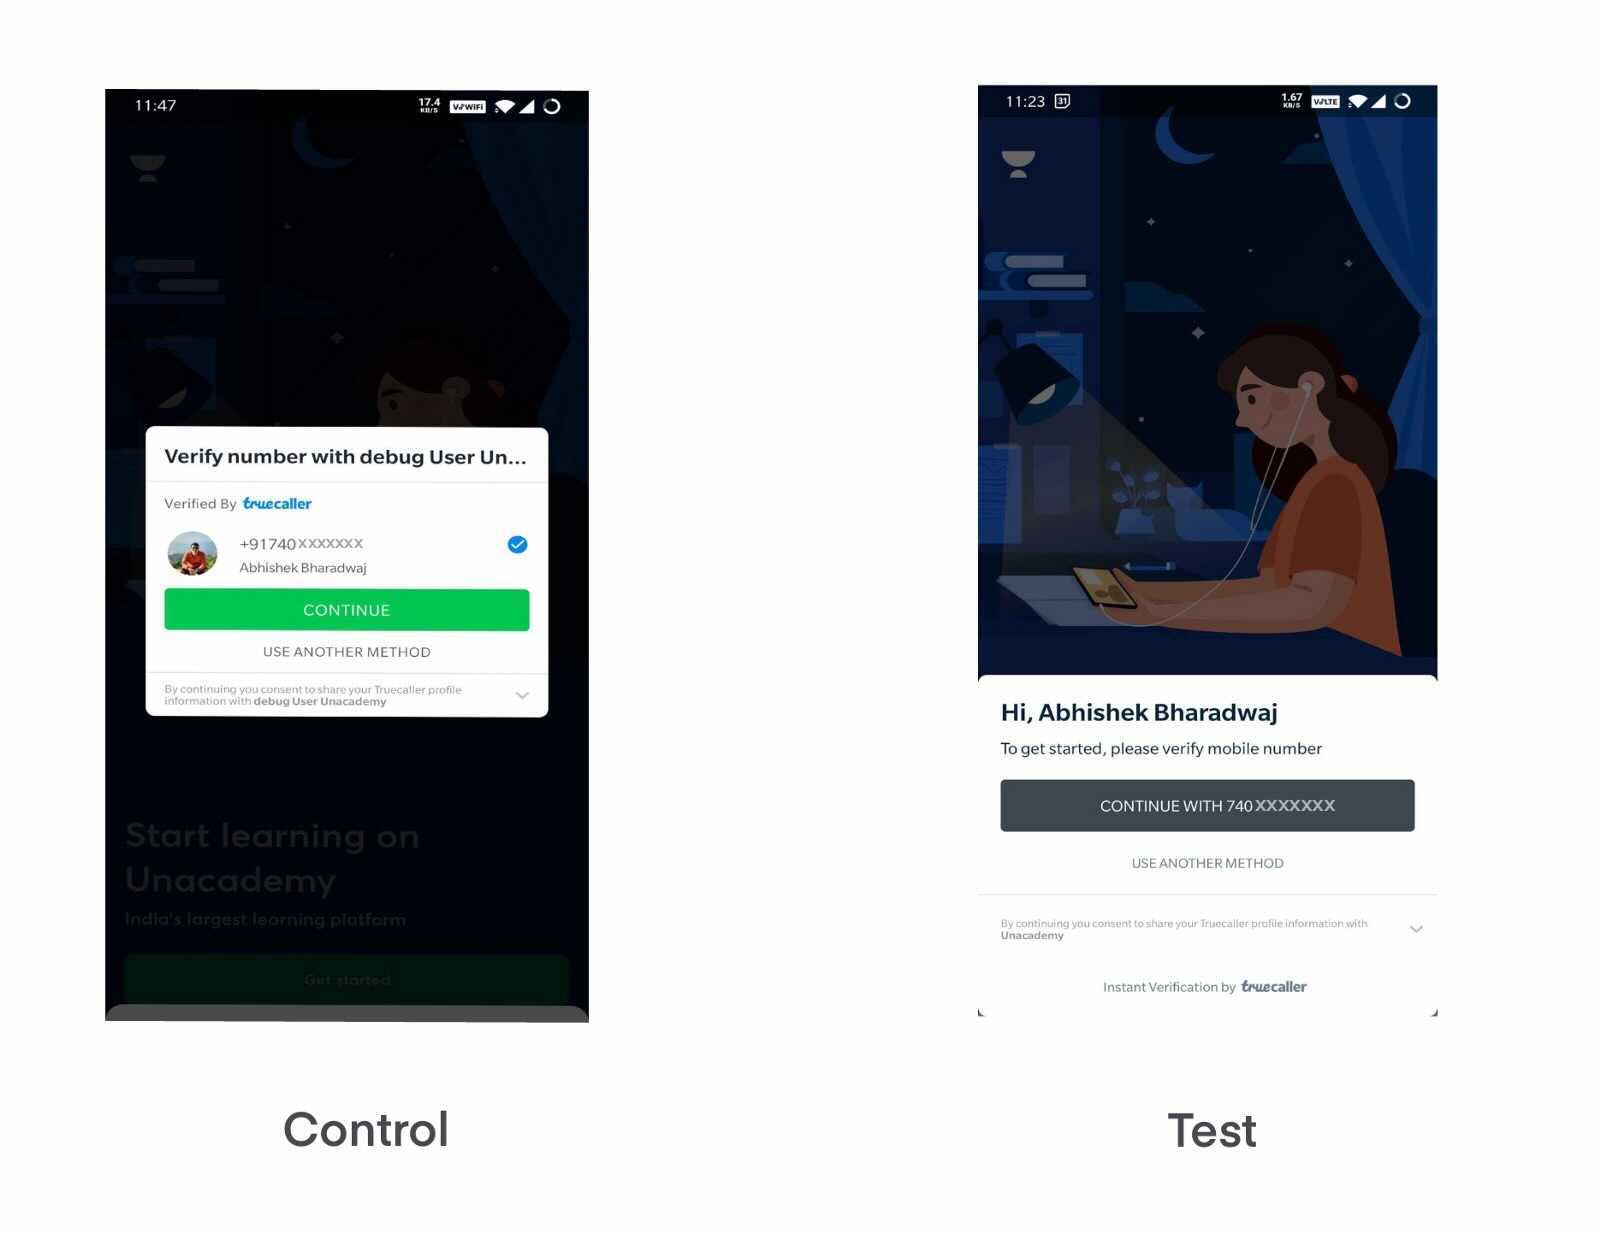
The results were aligned with our hypothesis and our average login time was reduced by 23% while having a very low impact on onboarding funnels with low significance.
Learning: Placement of UI components matters, especially for bigger screen sizes!
Conclusion
We can run A/B experiments anywhere. There is no need to tie A/Bs directly with the final business metrics like revenue. They can be as simple as text changes, given that you are able to measure their impact independently.
One last thing, the majority of experiments don’t result in any significant wins for us but pave ways for learning and future experiments.